SRSHOW THIS WAS MADE

HOW THIS WAS MADE

This is how the Sydney Revival School page was made: a speculative proposal to keep the Sirius building as housing and add an art school, set before 2017. Each section covers one thing that was made, what went wrong making it, and what to do about that next time.

The page argues five things through one elevation: housing, heritage, education, activation and sustainability. Each has an image and a drawing. Almost every image was generated. The drawings were made from sources, measurements and a marked-up plan. Where a tool was asked to make something it shouldn't, that's said here too.

Read the instructions as advice, not rules. They come from one building, one set of tools and eight working sessions over five days. Some will hold for your project and some won't. The tools will also change faster than anything else on this page, so treat anything about how a tool behaved as dated.

Two earlier versions of the page are kept online beside this one, so you can see what changed between drafts: the first live draft and the second.

01

The client and the brief

The client was worked backwards from an earlier return brief. Every point was marked as either sourced or invented, and three candidate street addresses were checked against the one register that assigns them.

Mark what you made up, and check the cheap facts at their source.

Read the full accountClose the full account

Nobody commissioned this building, so start by making a client you can test. Work backwards from a return brief you've already written. Ask for the client's pressures, not their preferences, because an image can test a pressure and can't test a taste.

What came back was nine points: four traced to the document and five marked as invented. Keep that marking. A client you've partly invented is fine. One you've forgotten you invented isn't.

Then cut anything that doesn't bear on space or image. An advisor named in the tender went, because it was procedure. A Level 6 resident as a stakeholder went, because it belonged to a different brief and would have split the client's voice in two. One point came back wrong for the design: the art school placed on a separate site beside the building. It was changed to a school lofted over Cumberland Street from the west. That's a bridging move, and the drawings then had to test it.

Last, the address. Three plausible sources gave three different answers: 36–50, 38–70 and 2–60. Only one of them assigns addresses, the NSW Spatial Services register, and it holds 2–60. The check took minutes.

Before you build anything on a fact, find the source that holds it rather than the ones that repeat it.

02

The generated images

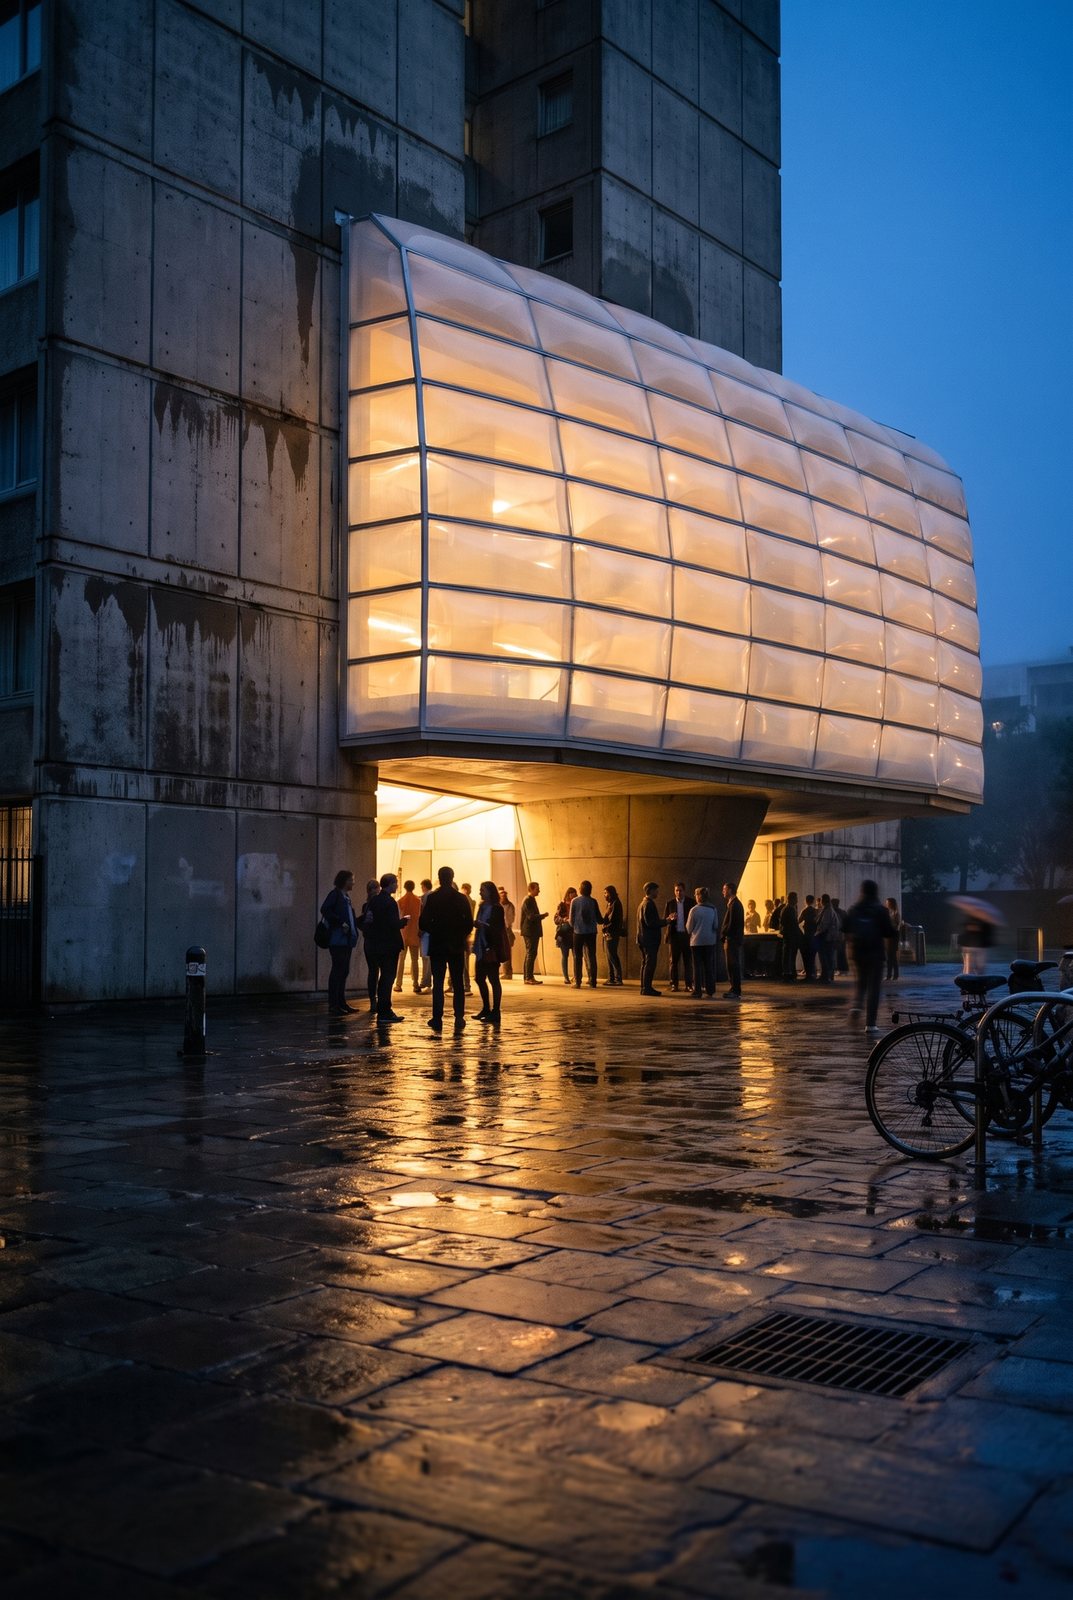
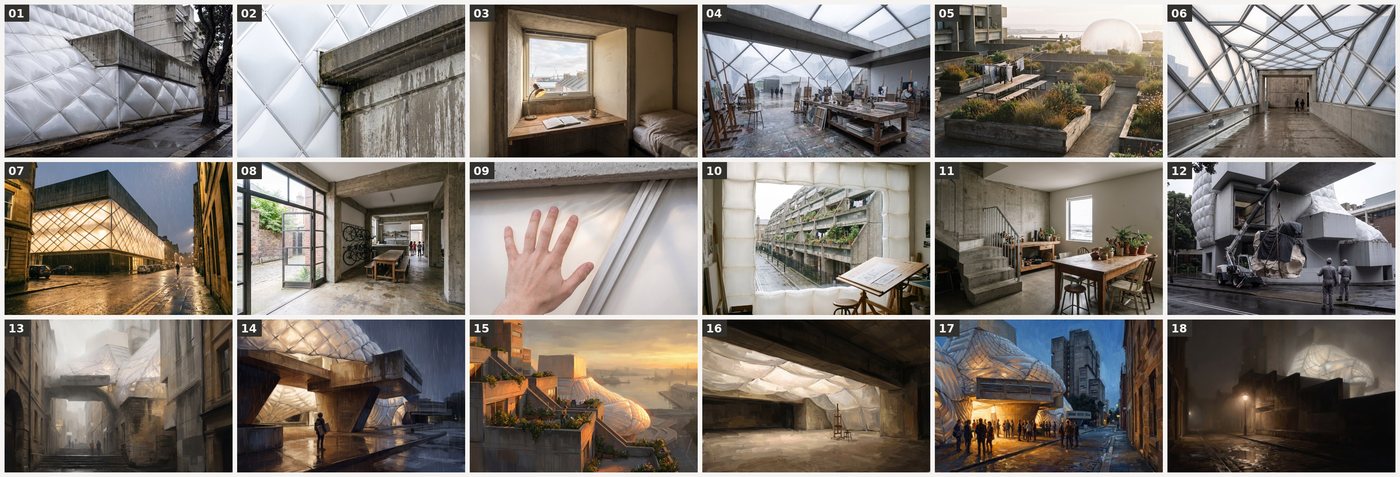
Forty images came back from eighteen prompts. The whole contact sheet is kept as the record, and anything that didn't serve one of the five principles was cut. The main finding was that asking for a correction changes nothing that's already there. Describing the new thing in physical terms does.

Describe the object you want, not the fix to the image you got.

Read the full accountClose the full account
The first pass as a contact sheet. Everything that came back is kept, including what was cut.
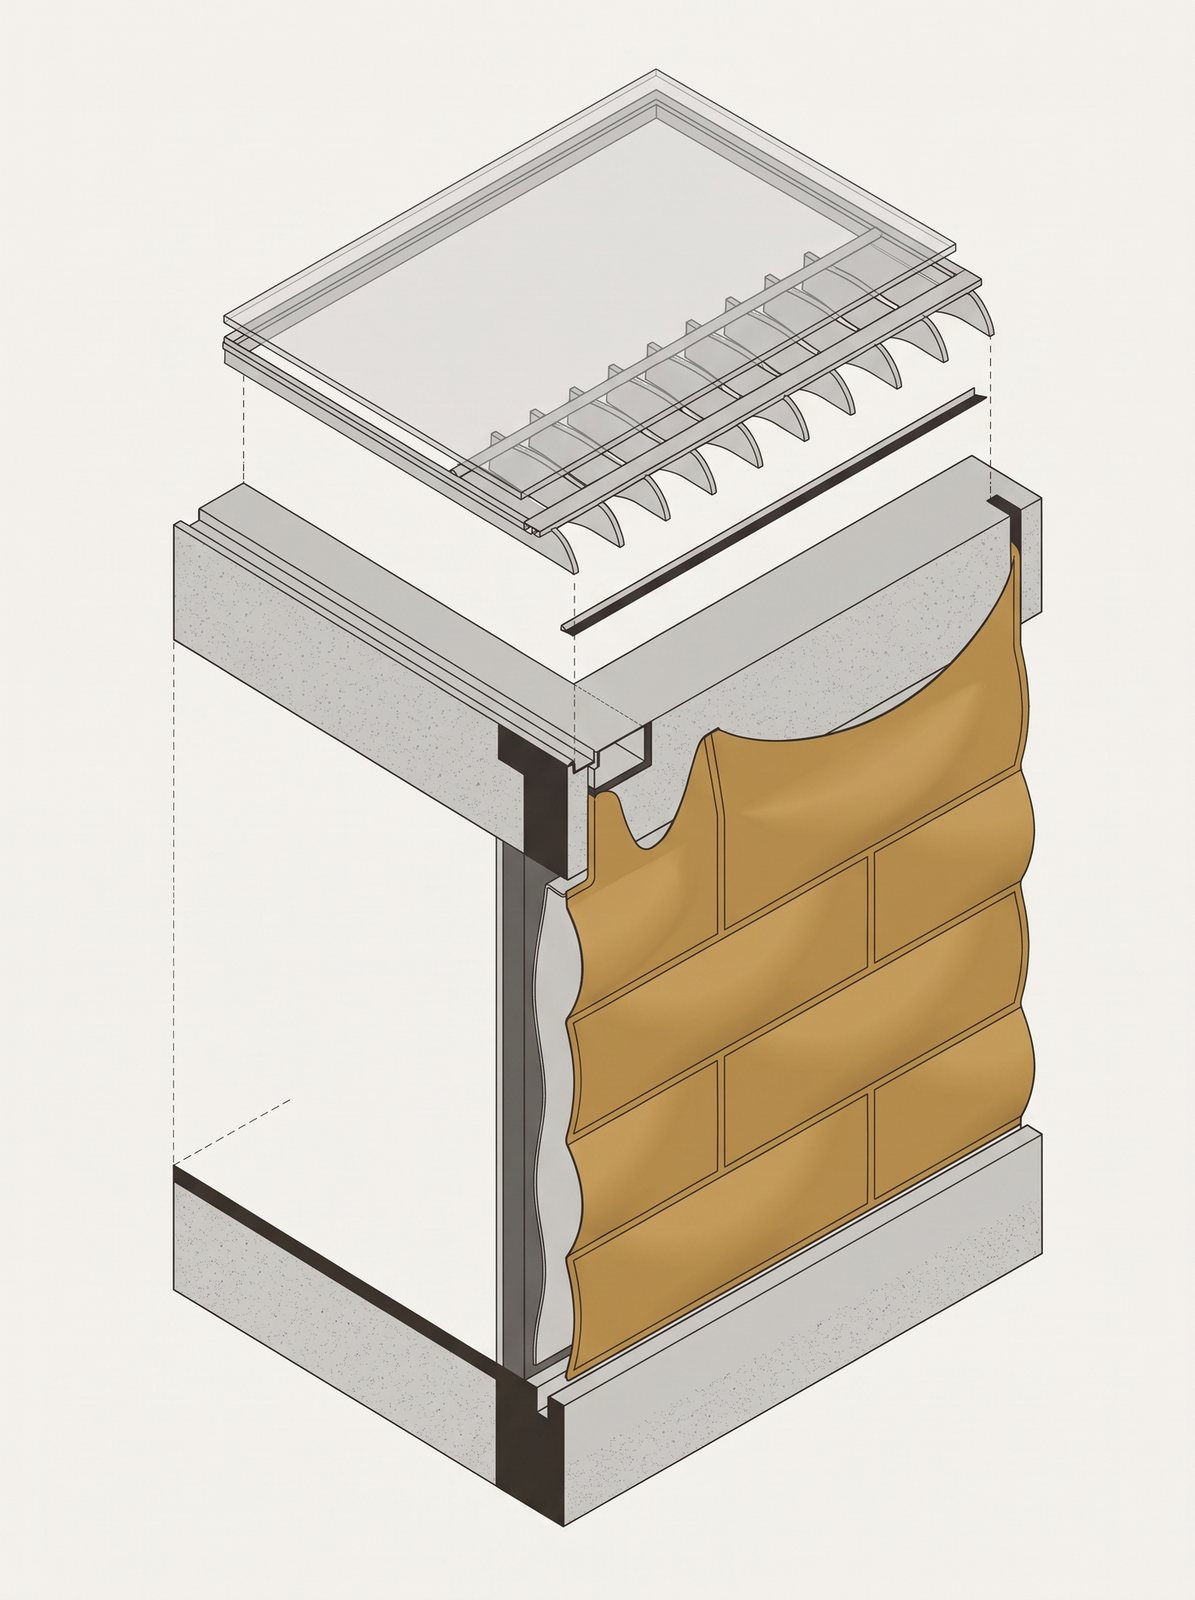
Cut: a cutaway of the cladding junction. A good drawing, but an assembly, not an argument.
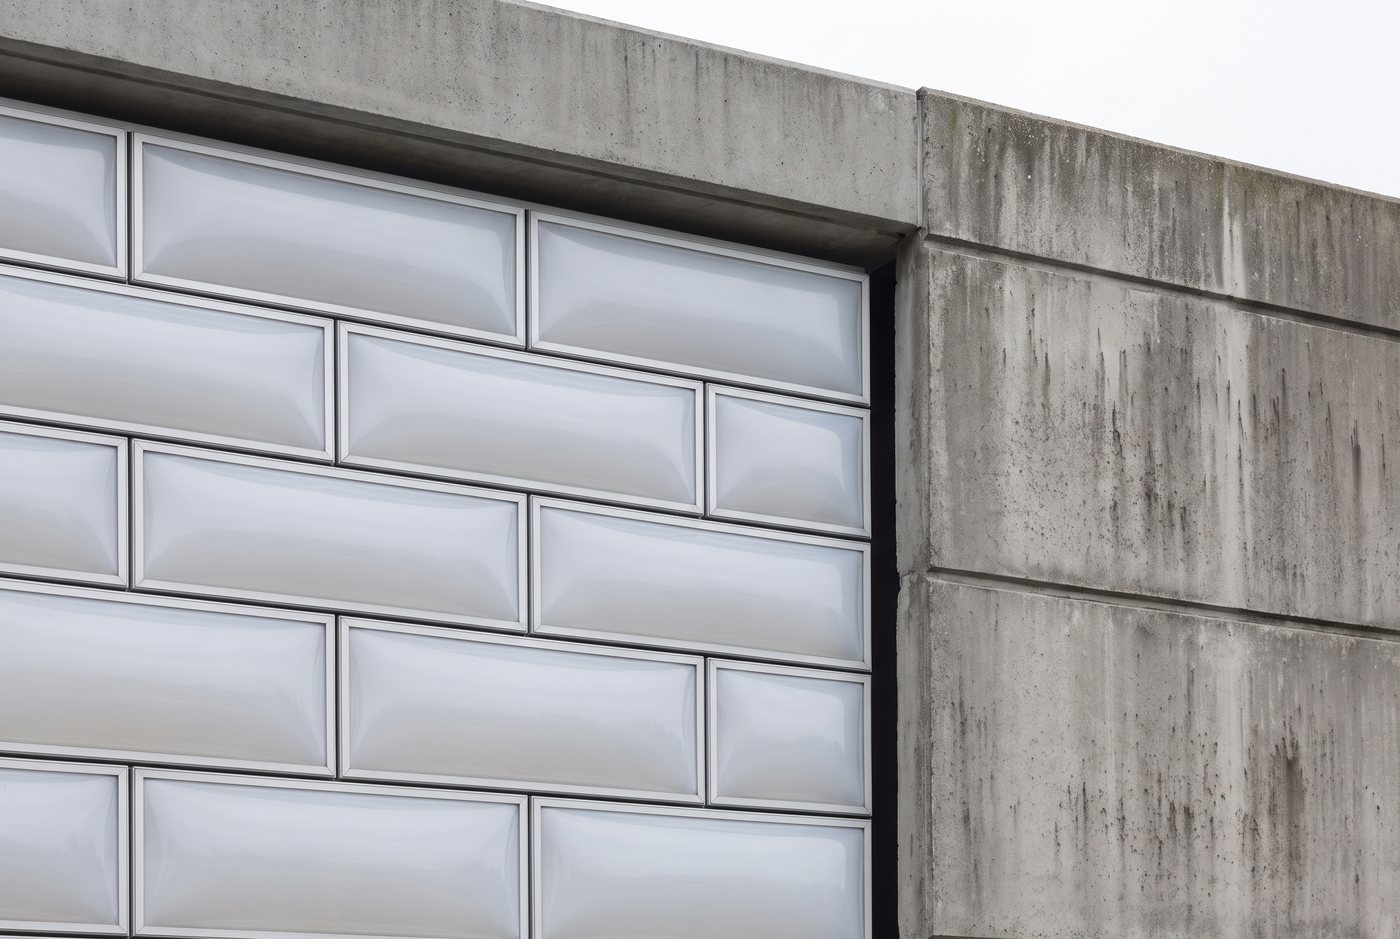
The cushion skin as glazed subway tile, with "subway tile" already in the negative prompt.
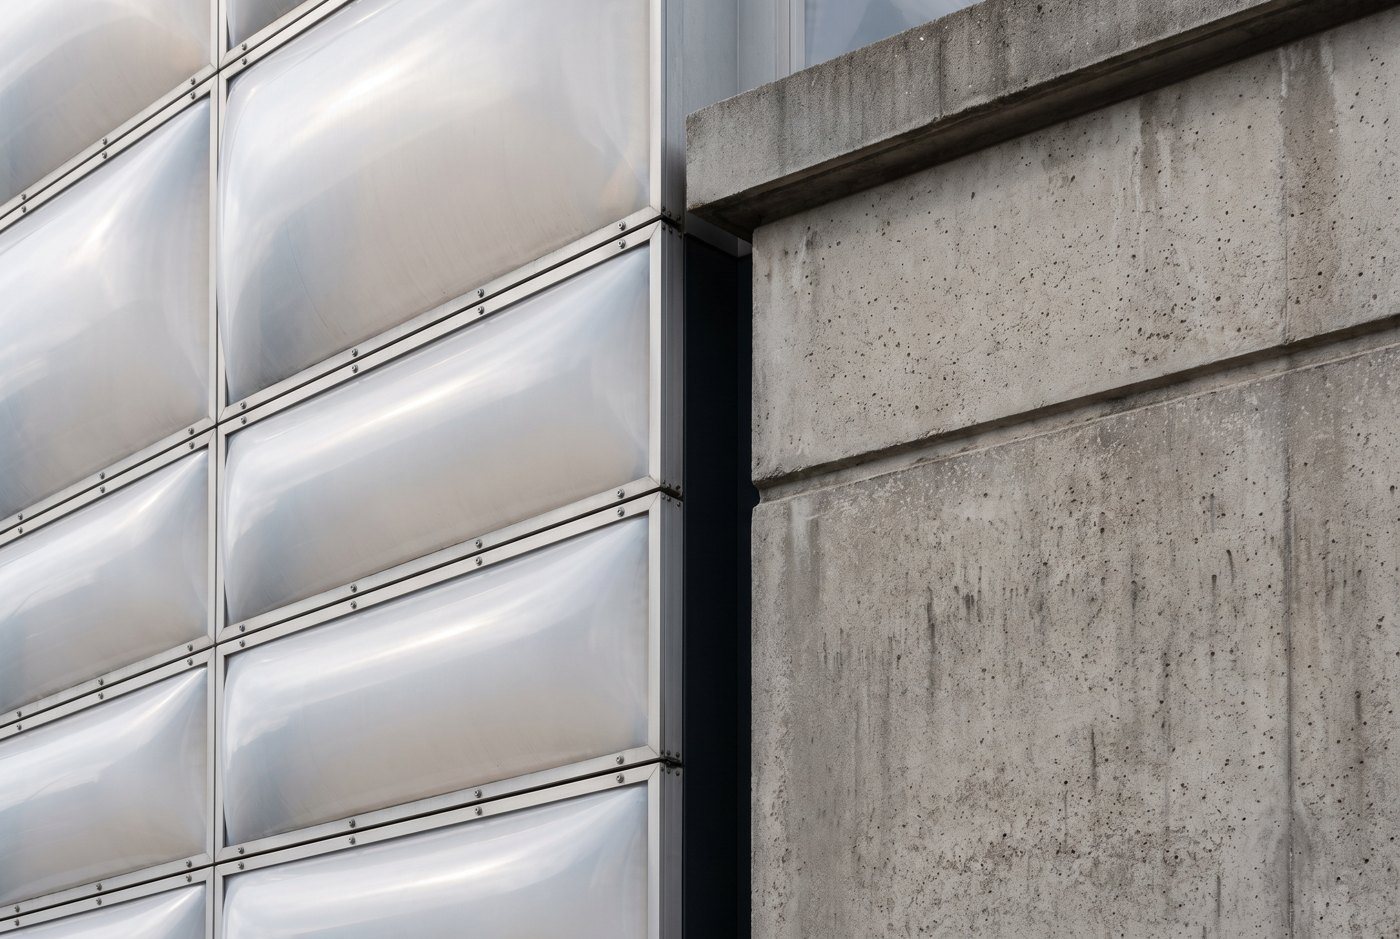
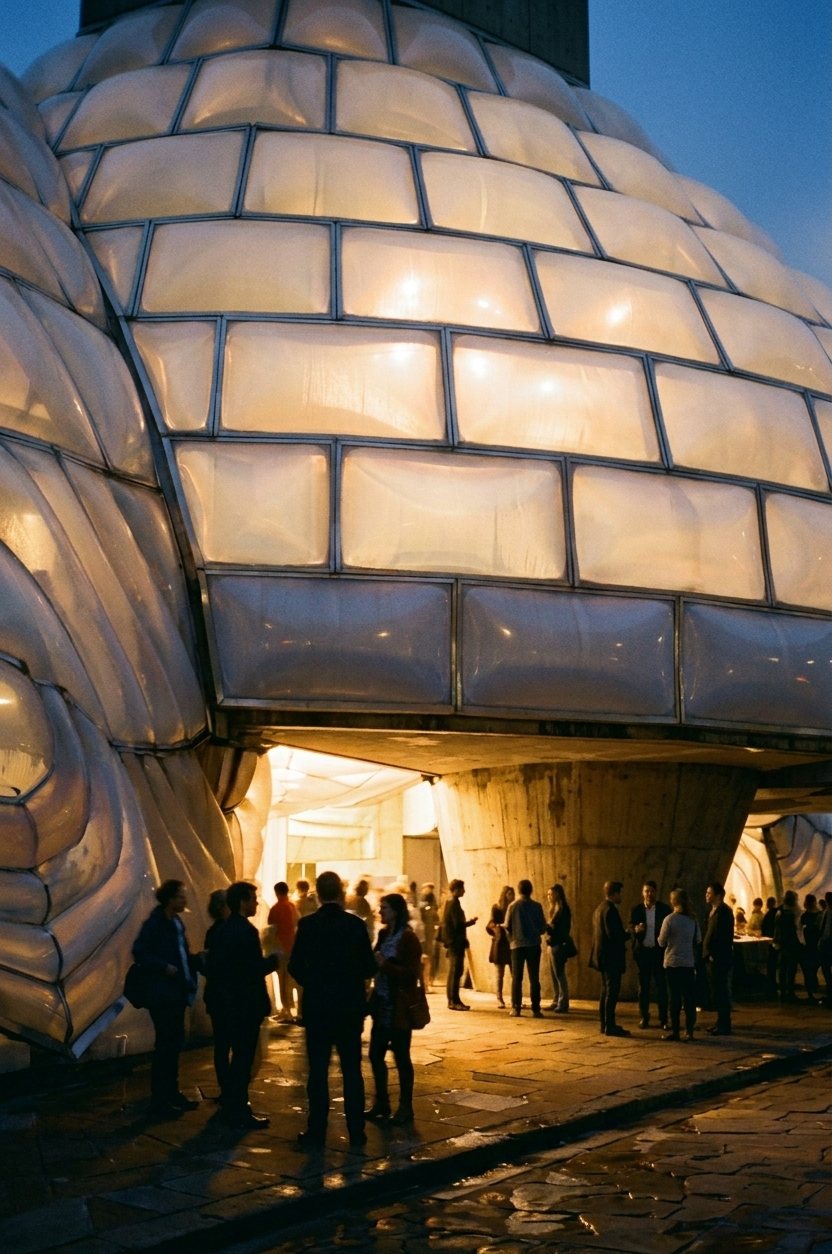
After the physics was described: pneumatic, bulging, swelling under pressure. This is the image on the page.
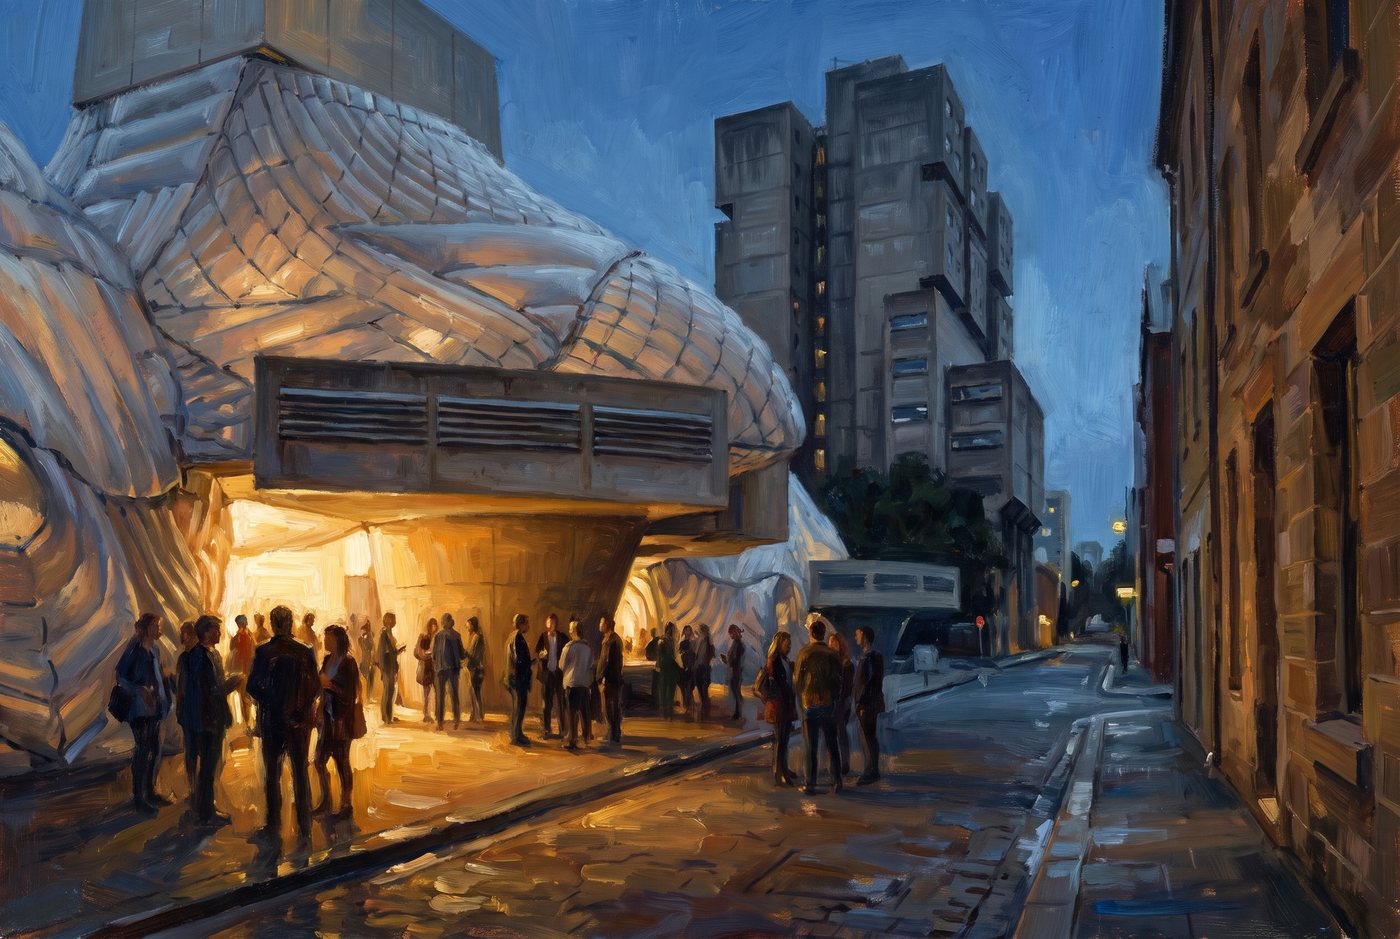
The opening-night image as first generated.
Repanelled by describing the new skin. The panels changed, and so did the composition: it regenerated rather than edited.
A photograph generated afresh: good light, but the composition moved and the canopy flattened into a box.
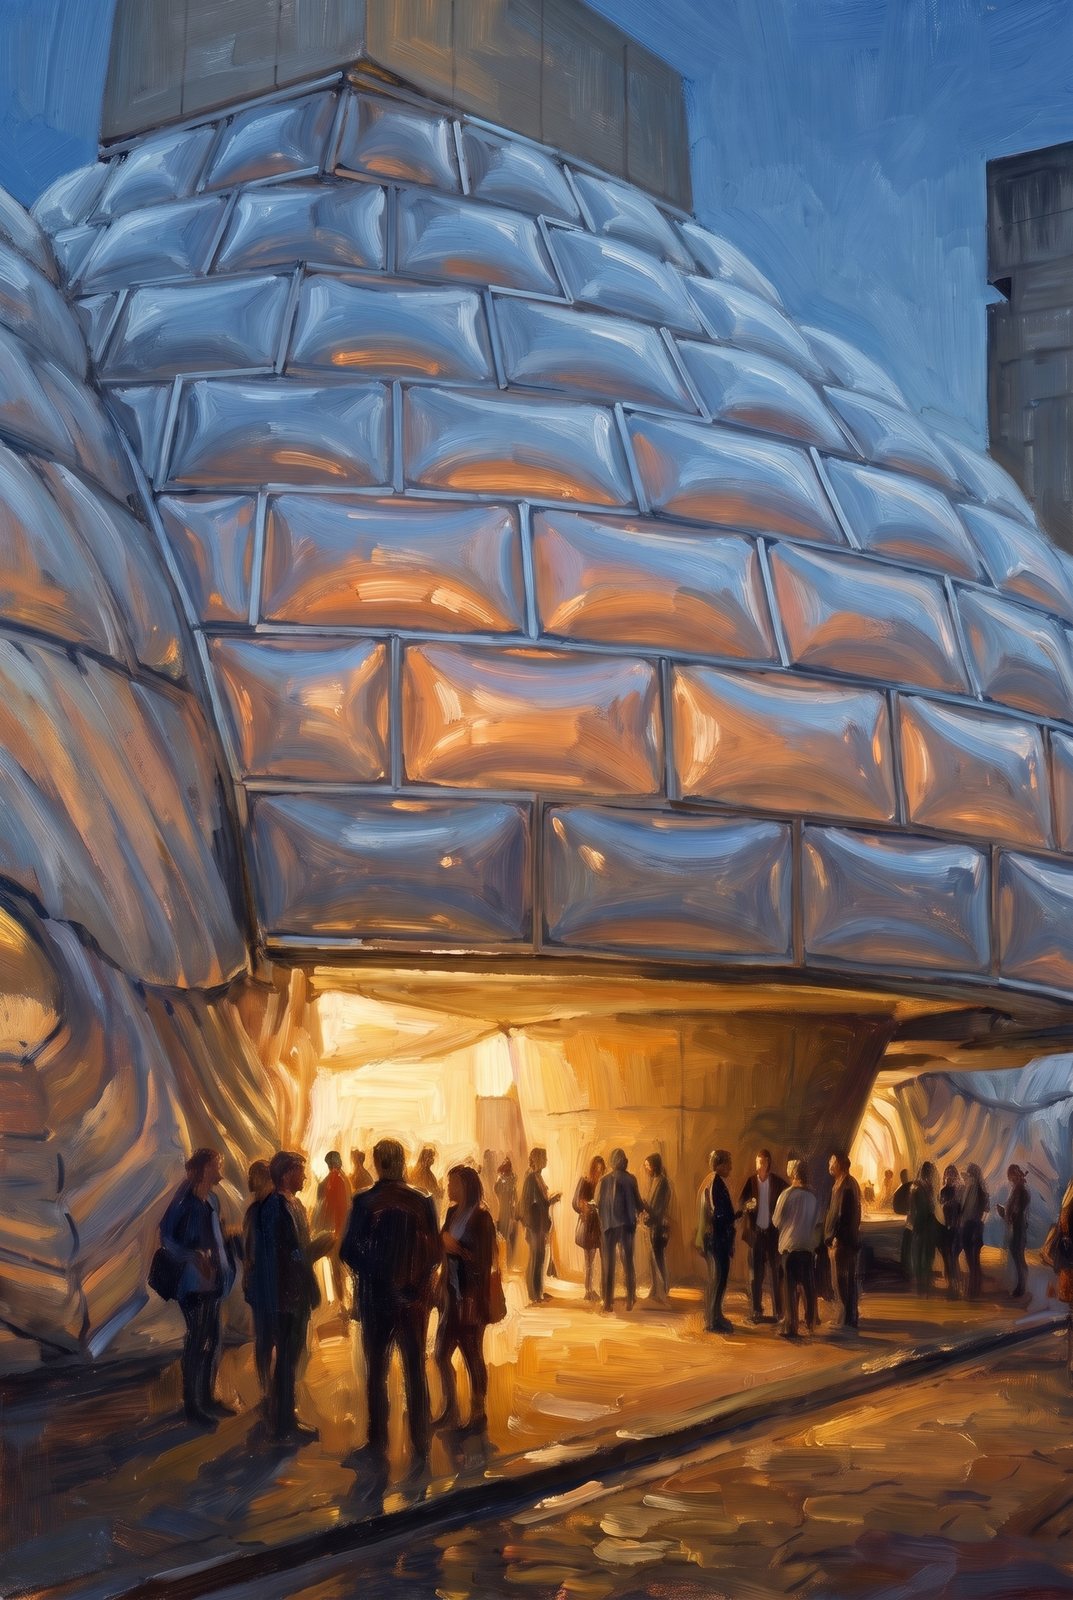
A single-image edit of the painting, changing only the medium. The composition held. This is the image on the page.

Keep everything that comes back. The contact sheet of a whole pass is the evidence of your judgement, including the images you cut. Eighteen prompts over four passes returned forty images.

Cut by purpose, not by quality. A cutaway of the cladding junction came back looking good and was cut, along with two flat-section versions of the same detail, because this brief asks for a concept, and a concept is an argument, not an assembly. A conceptual section and a draped elevation went for a simpler reason: they served none of the five principles.

Then expect this limit. Feed back the last image with a written list of corrections, and the tool will apply everything you add (a palette, a missing layer, detached fins) while copying the existing geometry across unchanged. The bay depth and profile were identical over two passes. Generation adds. It doesn't revise.

There's a way around it, and it's worth knowing exactly how it works. When a sustainability image rendered its pneumatic cushion skin as glazed subway tile, putting "subway tile" in the negative prompt didn't help. It came back as subway tile again. Describing the physics did: pneumatic, bulging, swelling under pressure. The same thing worked when a facade needed repanelling. Describing the replacement object landed, where describing a correction to the existing image hadn't. It still regenerated rather than edited, so the composition shifted, which means the limit stands and only the phrasing changed. A request for a whole-building view with a rooftop addition never got past faceted glass boxes. The model's idea of that object was too firm to move.

If what you've already won is the composition, don't generate again. Edit. The activation image had to become a photograph. Generating afresh from the painting gave good light but a different composition, and in one version the billowing canopy flattened into a box. A single-image edit of the original, changing only the medium, kept the composition exactly.

Two smaller habits. Look before you act on a flag: a face rule raised against the workshop image turned out to be overstated, since the welder is masked, the sculptor is seen from behind, and the only face in frame belongs to a clay figure. And check what you've been given: two of the housing images were JPEGs saved under a .png name.

Every generated image here is labelled as generated. The housing set of three (fabric, upgrade, light and air) carries a second label too, saying it's a hypothetical refurbishment and not the real redevelopment.

When a correction doesn't land, stop correcting. Describe the thing itself, or edit the original.

03

The heritage film

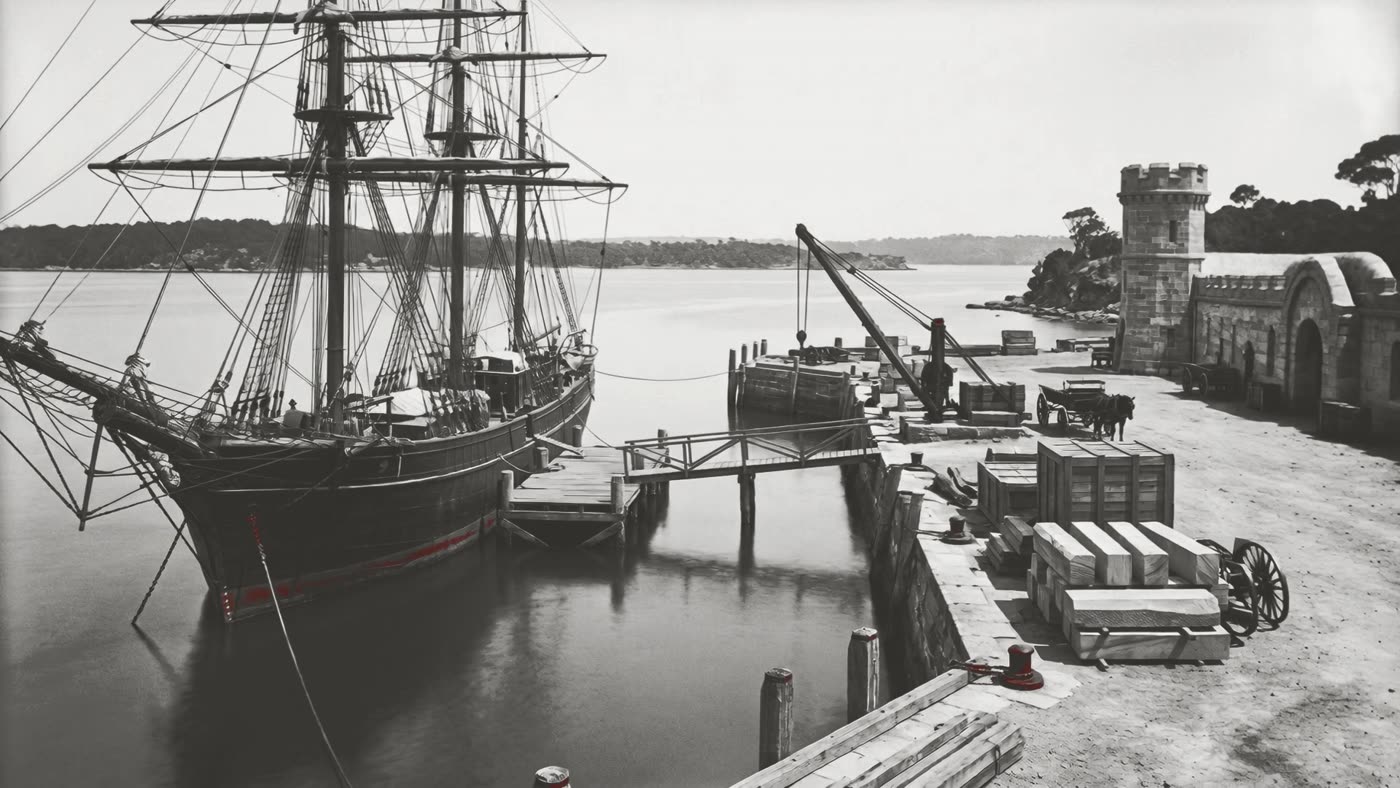
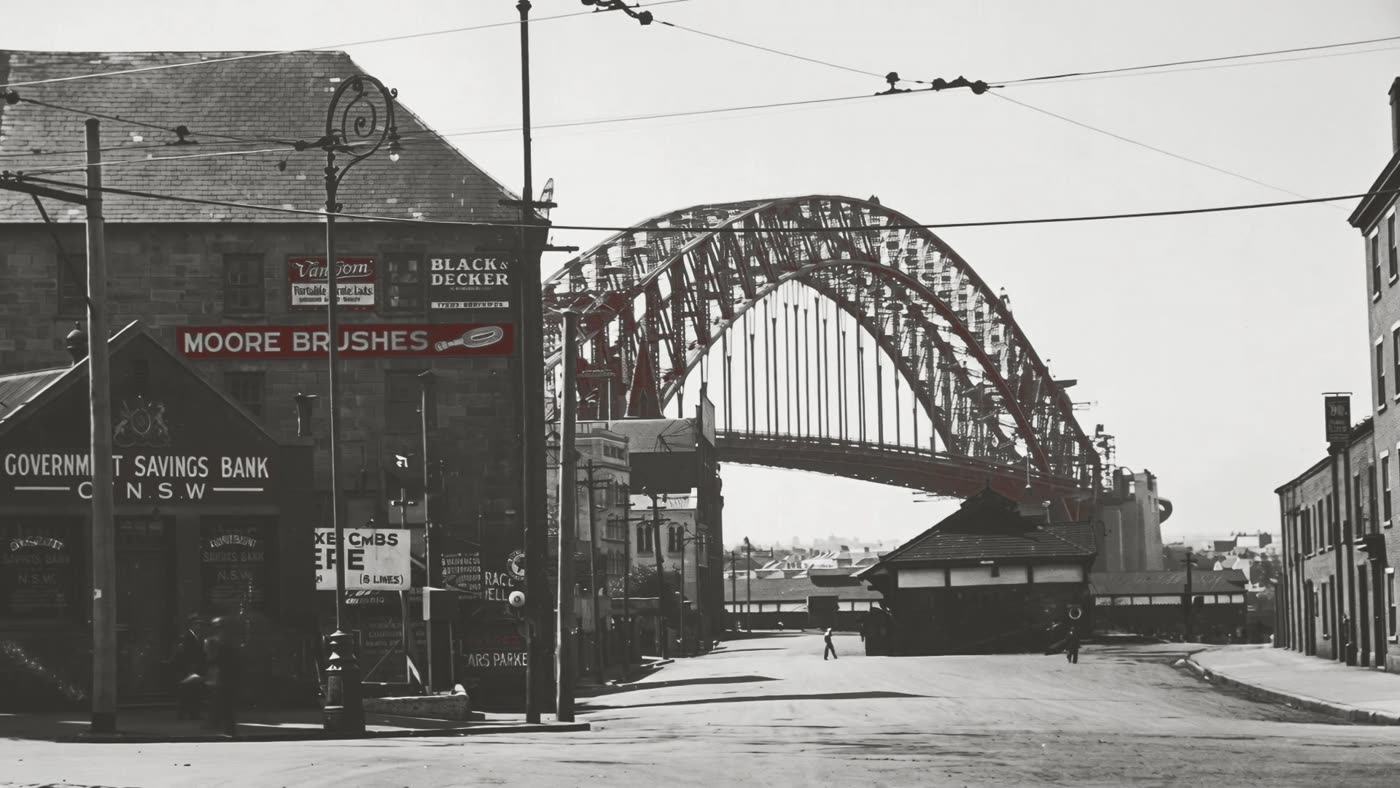
Twelve found images, from the harbour before colonisation through to Sirius, were each regenerated as a photograph, animated, colour-matched and crossfaded into a 26-second film. It breaks two rulings made earlier in this project, knowingly, and it says so in its credit.

Disclose what you did, and don't mistake disclosure for permission.

Read the full accountClose the full account
Frame 4: the colonial port, regenerated as a photograph and graded to the film's one palette.
Frame 6: a street under the bridge arch, 1931.
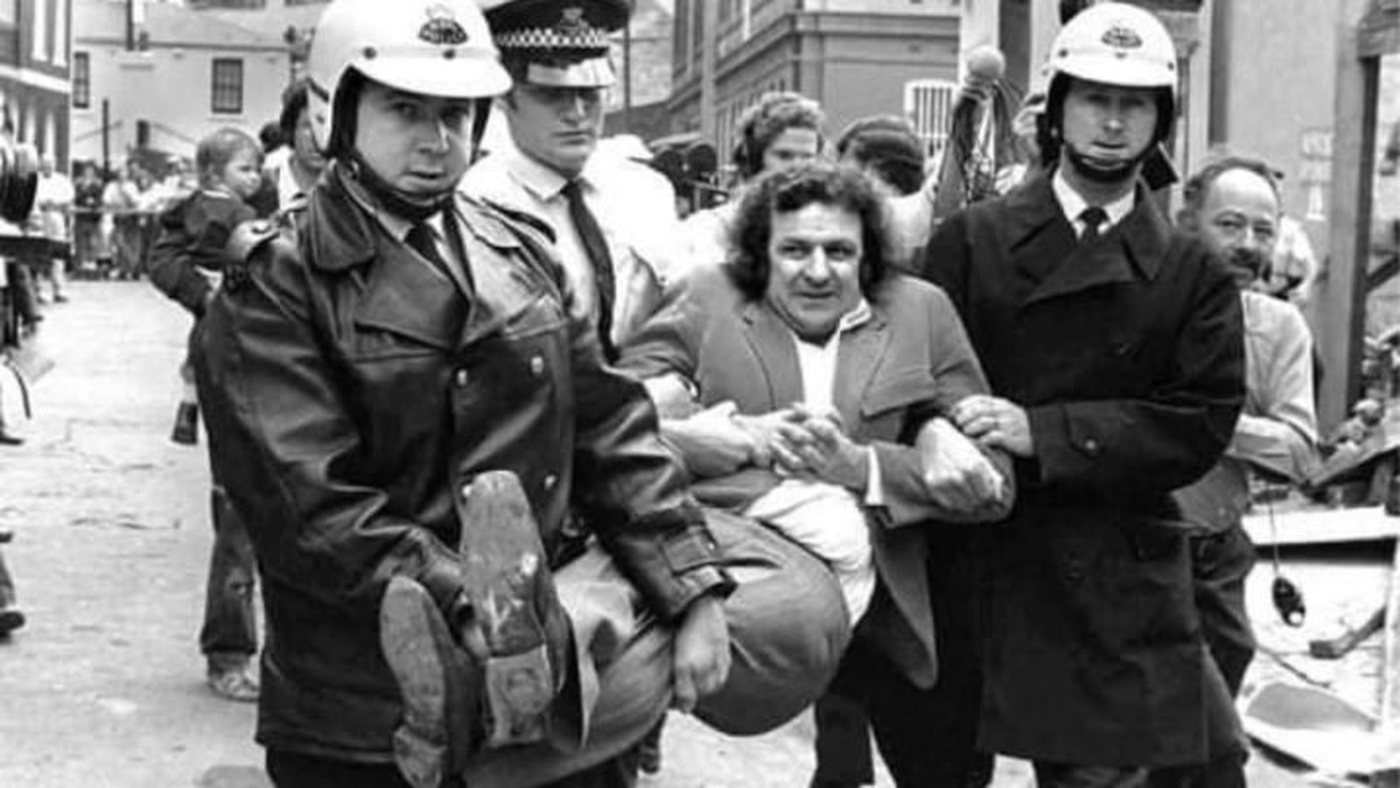
The source for frame 9: Tribune, December 1977 (CC BY 4.0).
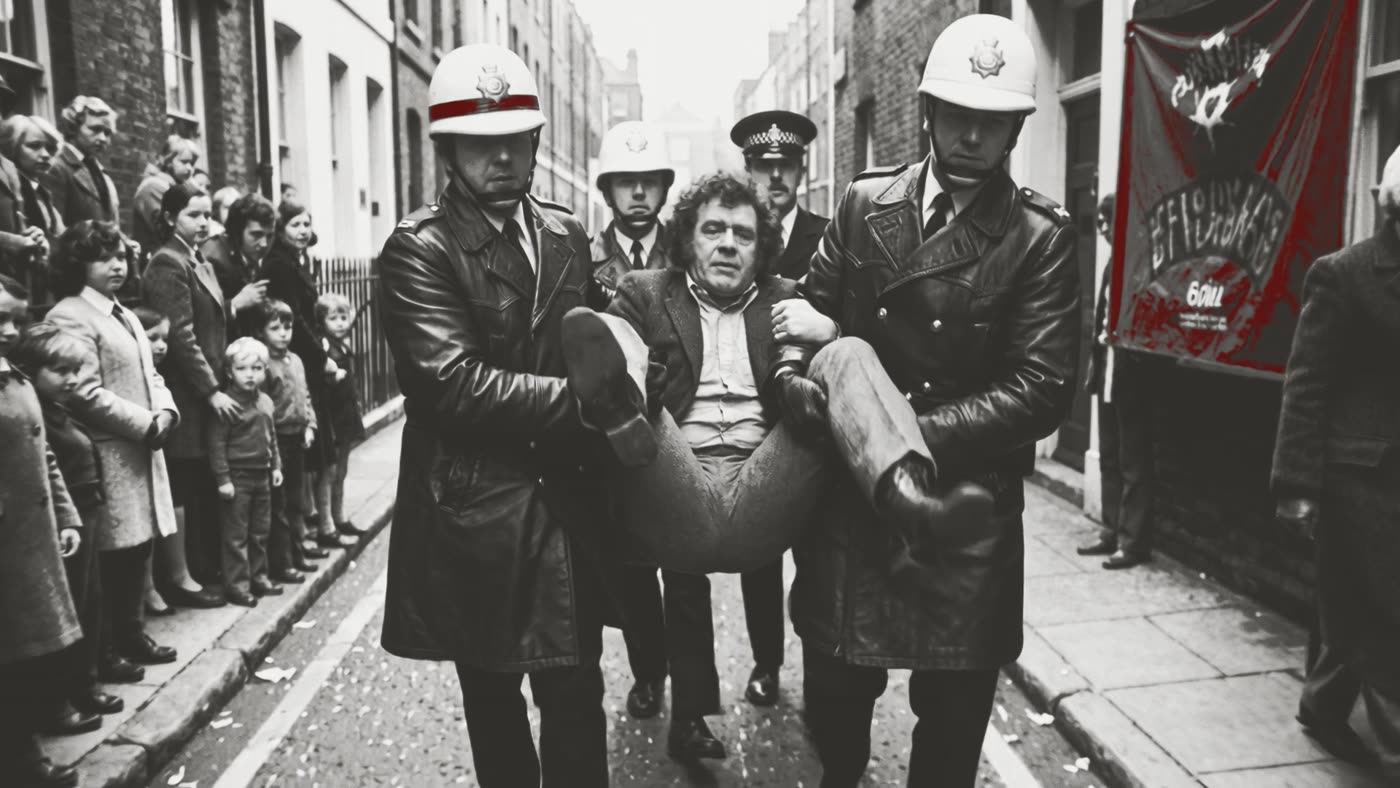
Frame 9, regenerated from it. The film's only colour is red, and it builds towards this frame and the next.
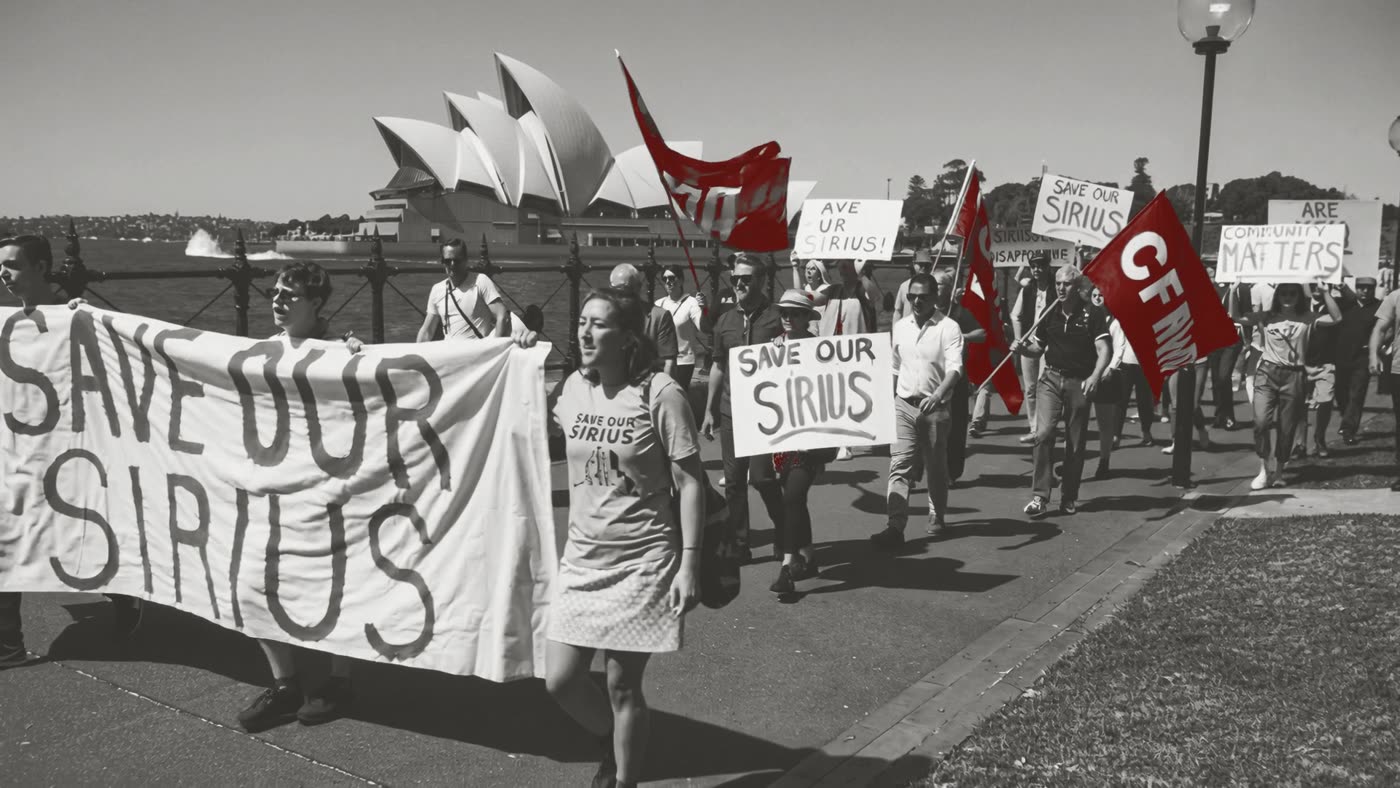
Frame 10: the Save Our Sirius march.
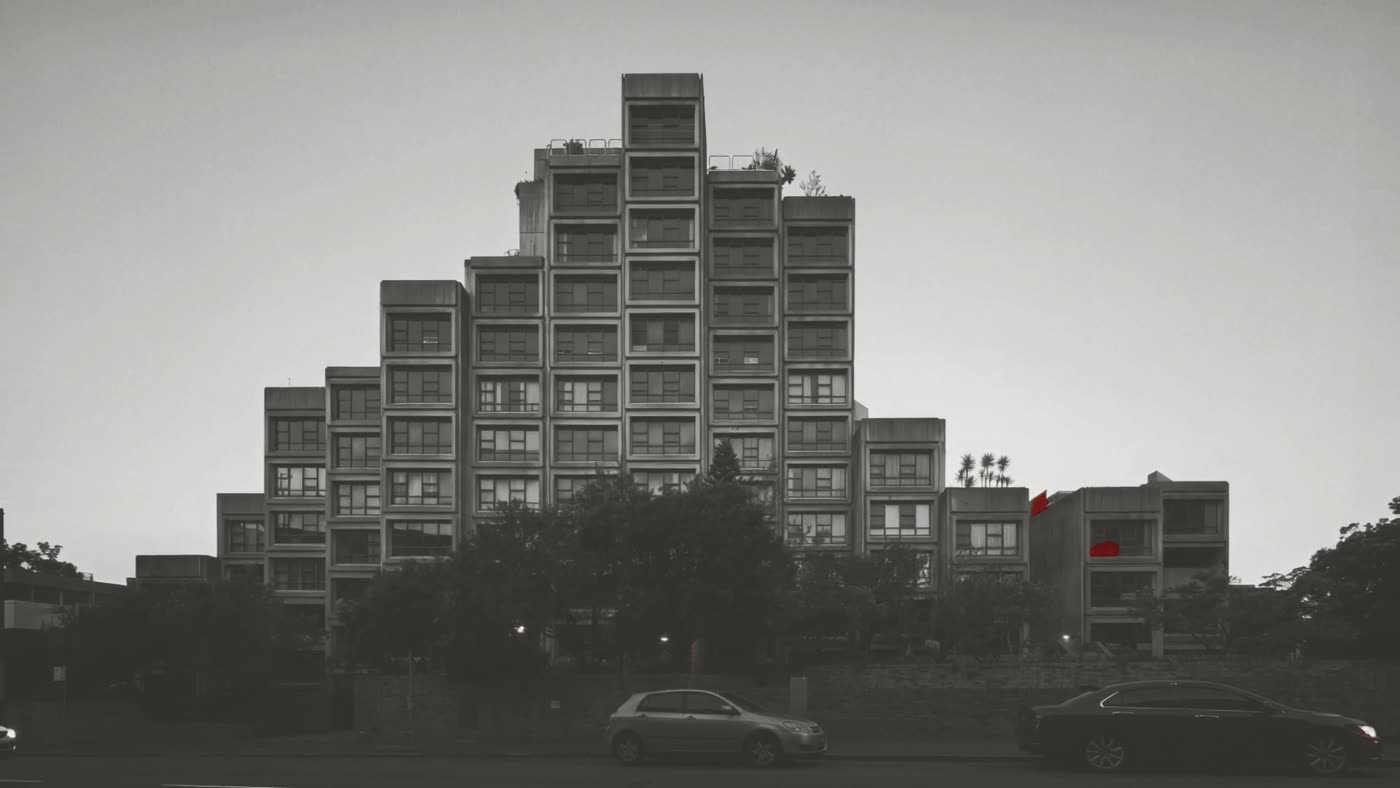
Frame 12, the last: Sirius at dusk. The only shot where the camera pulls back.

The three opening frames and frame 7 are not reproduced here.

Start with what you're allowed to use. For this building, footage and generated imagery were ruled out early. News, social media and film carry third-party copyright. Generated depictions of Aboriginal people need consultation, not generation, and a teaching artefact teaches whatever it does. Rock art was ruled out too. There's none in The Rocks, because it was quarried and built over, and the engravings nearby are on different Country. A licence settles the photographer's copyright. It settles nothing about cultural rights.

What could be cleared was real material about this building and its campaign, under open licences: Tribune (CC BY 4.0) and Ben Guthrie / The Guthrie Project (CC BY-SA 4.0).

Then the film arrived, and it went further. Each of twelve images was regenerated as a photograph, animated, locked to one palette and crossfaded so the joins read as time passing. Three of its frames are generated depictions of Aboriginal people and a rock engraving. A fourth derives from a copyrighted film still. Three alternatives were weighed: cut it to the eight cleared frames, show it only in class where it could be framed in person, or generate a new opening that reaches deep time without depicting people. The decision was to run it whole and label it hard.

Keep the two departures apart, because they aren't the same kind of thing. The first is a judgement about cultural protocol, and it's the author's to make and answer for. The second is someone else's copyright, and no label changes that position. Naming it on the page is honest. It isn't a licence.

The working details are quicker. At 38.5 MB the film was about three times more than its plate can show, so it went down to 3.97 MB at 1280 × 720, silent, with no visible difference at the size it's seen. It starts when the plates land and stops as soon as you leave the state, so nothing plays off screen. When the checking browser couldn't play it, the fault looked like the page's. It was the browser's, which had no decoder for the format. Before you fix a fault, find out whose it is.

Write down what you're departing from, and why, before you ship it. A credit can make a decision visible. It can't make it right.

04

The floor area

The carbon case needed the building's own area. The model's display failed four times, and two measuring methods failed outright. The one that worked gave two answers 164 m² apart. The larger one is used, with its method and its margin shown.

When the display fails, the data is usually still there.

Read the full accountClose the full account
The four attempts to capture a view from the live model: four identical blank images.

To make the carbon drawing about this building rather than a benchmark, you need its quantities. Go to the model, and expect it to fight you.

Try to see it first. Four attempts to capture a shaded view from the live model came back as four identical blank images, and the camera wouldn't leave top view. Stop there. Four is enough to know the display isn't going to work, and the geometry is still there to read directly.

Then measure, and throw out anything that isn't what it claims to be. Summing the wall solids gave 26,170 m³ of "concrete". But 474 of the 552 solids were 2,200 mm panels and a handful were 40 metres tall. That isn't a concrete quantity. Quoting it would have meant inventing a figure with a real number attached, which is worse than admitting the gap. Tracing floor area from the slab edges failed too. The edges weren't continuous, the fill leaked and it returned nothing. Say the method doesn't fit the geometry, rather than forcing it.

What worked was cutting the building into floors and counting the area on a grid: 12,726 m² at a 300 mm grid and 12,562 m² at 200 mm. Don't hide the difference, and don't chase it. Both options in the carbon comparison multiply the same area, so the percentage saving doesn't move either way. Re-deriving every figure to close a 1.3 per cent gap, inside a range 24 points wide, would be precision for show. The page states 12,726 m², names the method, and gives the finer run as its margin. Be honest about which way it leans too: a coarser grid counts more cells as filled, so the larger figure is the one more likely to be slightly high.

Only put a number on the page if you can say how it was measured and how far out it might be.

05

The carbon drawing

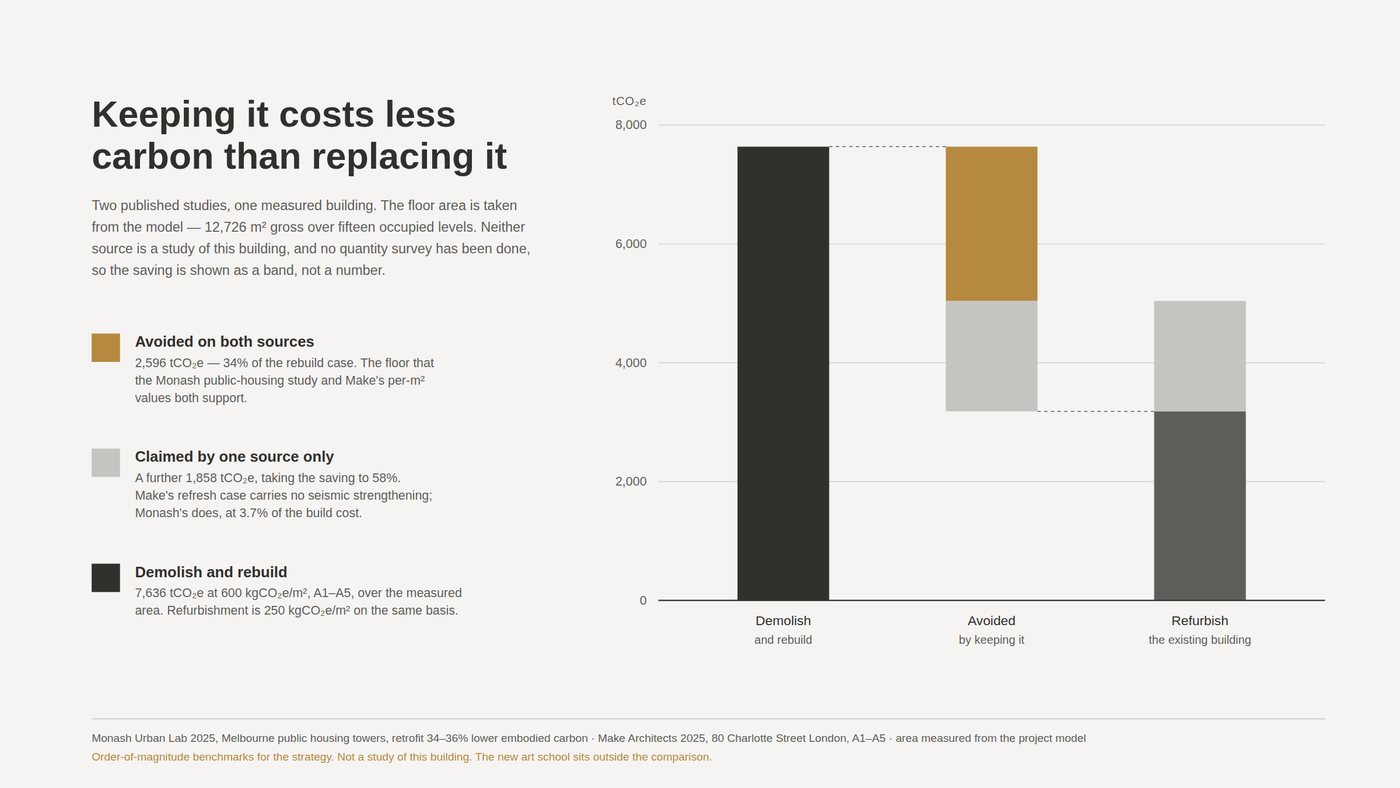
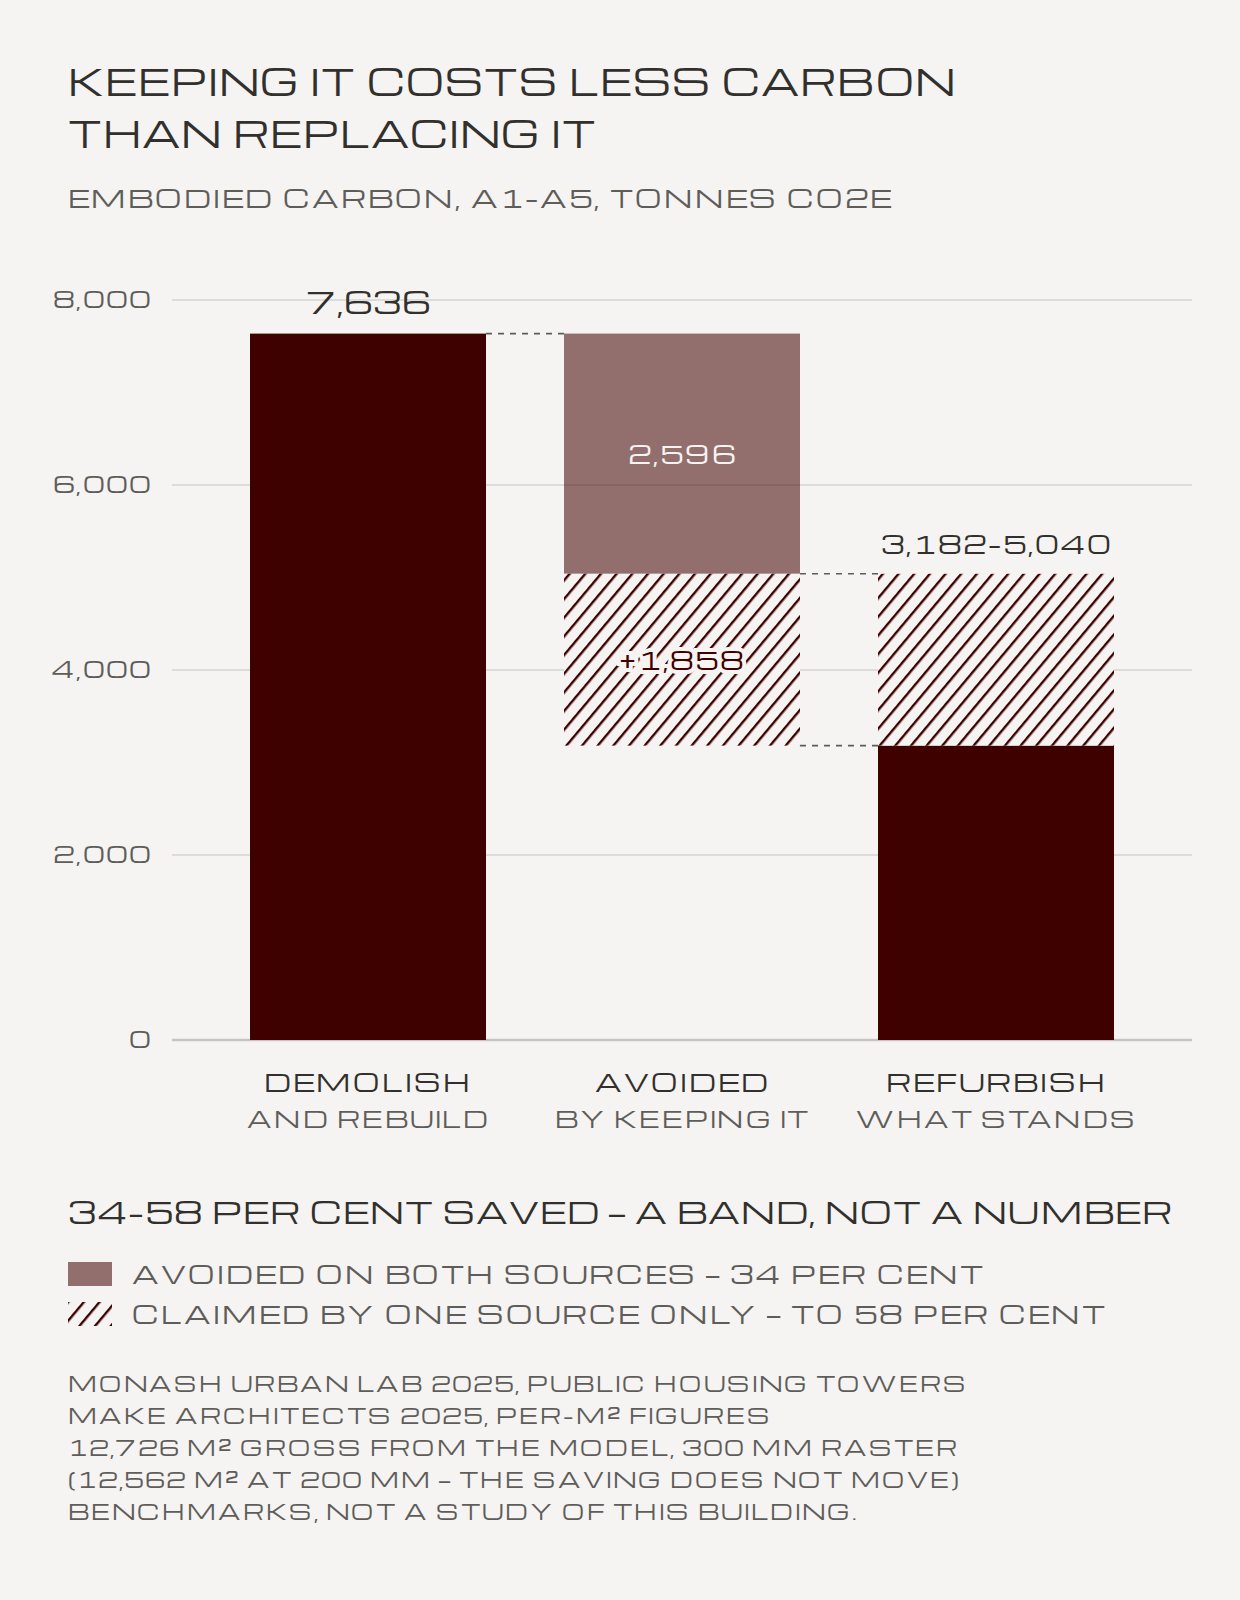
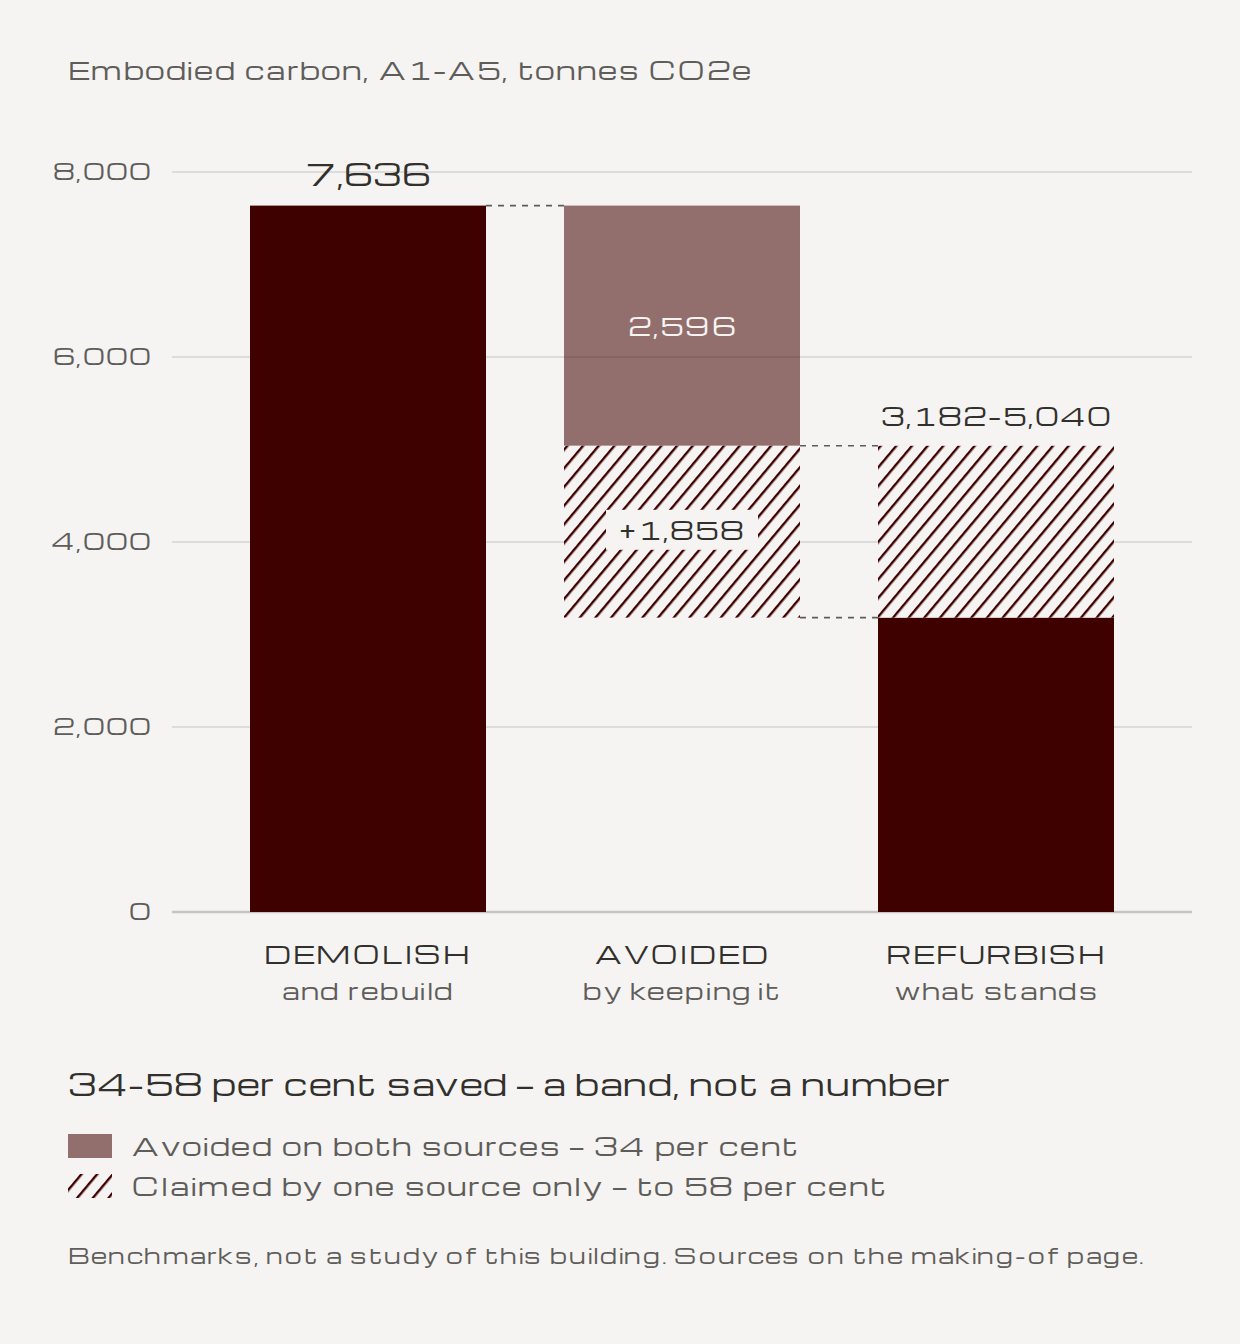
Two published studies disagree on how much carbon keeping a building saves: 34 to 36 per cent in one, 58 per cent in the other. The drawing shows the whole range rather than picking a number. It was plotted from the sourced figures and deliberately not generated.

Know which jobs generation can't do.

Read the full accountClose the full account
The first version, drawn as a sheet with its own heading, notes and accent colour.
Redrawn for its box on the page.
Now: heading off, sources moved to this page, the range drawn as a hatched band.

Look for the comparison closest to your building, and rank what you find. The first figures to come back were Make Architects' 2025 per-square-metre numbers: 250 kg of carbon for a refresh against 600 for a new build, from a London case study. That's useful for scale, but it's a long way from here. Monash Urban Lab's 2025 study was closer on every count: Australian, public housing towers, mid-century concrete, refurbishment set against demolition, and argued by architects. It found retrofit 34 to 36 per cent lower. Make as secondary, Monash as primary.

Then deal with the disagreement rather than choosing a side. The two differ because Monash's retrofit includes seismic strengthening and Make's refresh includes none. A single confident number would be false precision, and the spread is the more interesting fact. So draw the range: 34 to 58 per cent, with both sources named. The refurbishment bar is solid to 3,182 tonnes and banded to 5,040, so the range is drawn rather than just stated. Say plainly what it is, too: benchmarks, not a study of this building.

Don't generate a chart that carries quantities. A waterfall's bar heights are the argument. Generate one and the tool invents the heights, and the numbers stop being the cited ones. This one was declined before it was ever run and plotted from the sourced table instead.

Check your own checks as well. Partway through, the 34–58 range was flagged as a probable typo. It wasn't. It was a decision already on the record, and the flag was withdrawn the same session. Keep corrections you make against yourself in the record, because they're part of the method.

Last, the finish. A reviewer called the first version correct but a stock chart. The heading came off, the sources moved here, and the bars now rise one after another, left to right. The page's typeface draws the percent sign badly at caption size, so "per cent" is written out.

If a drawing's numbers are its argument, plot them from the source. Never let a generator draw a quantity.

06

The tenure drawing

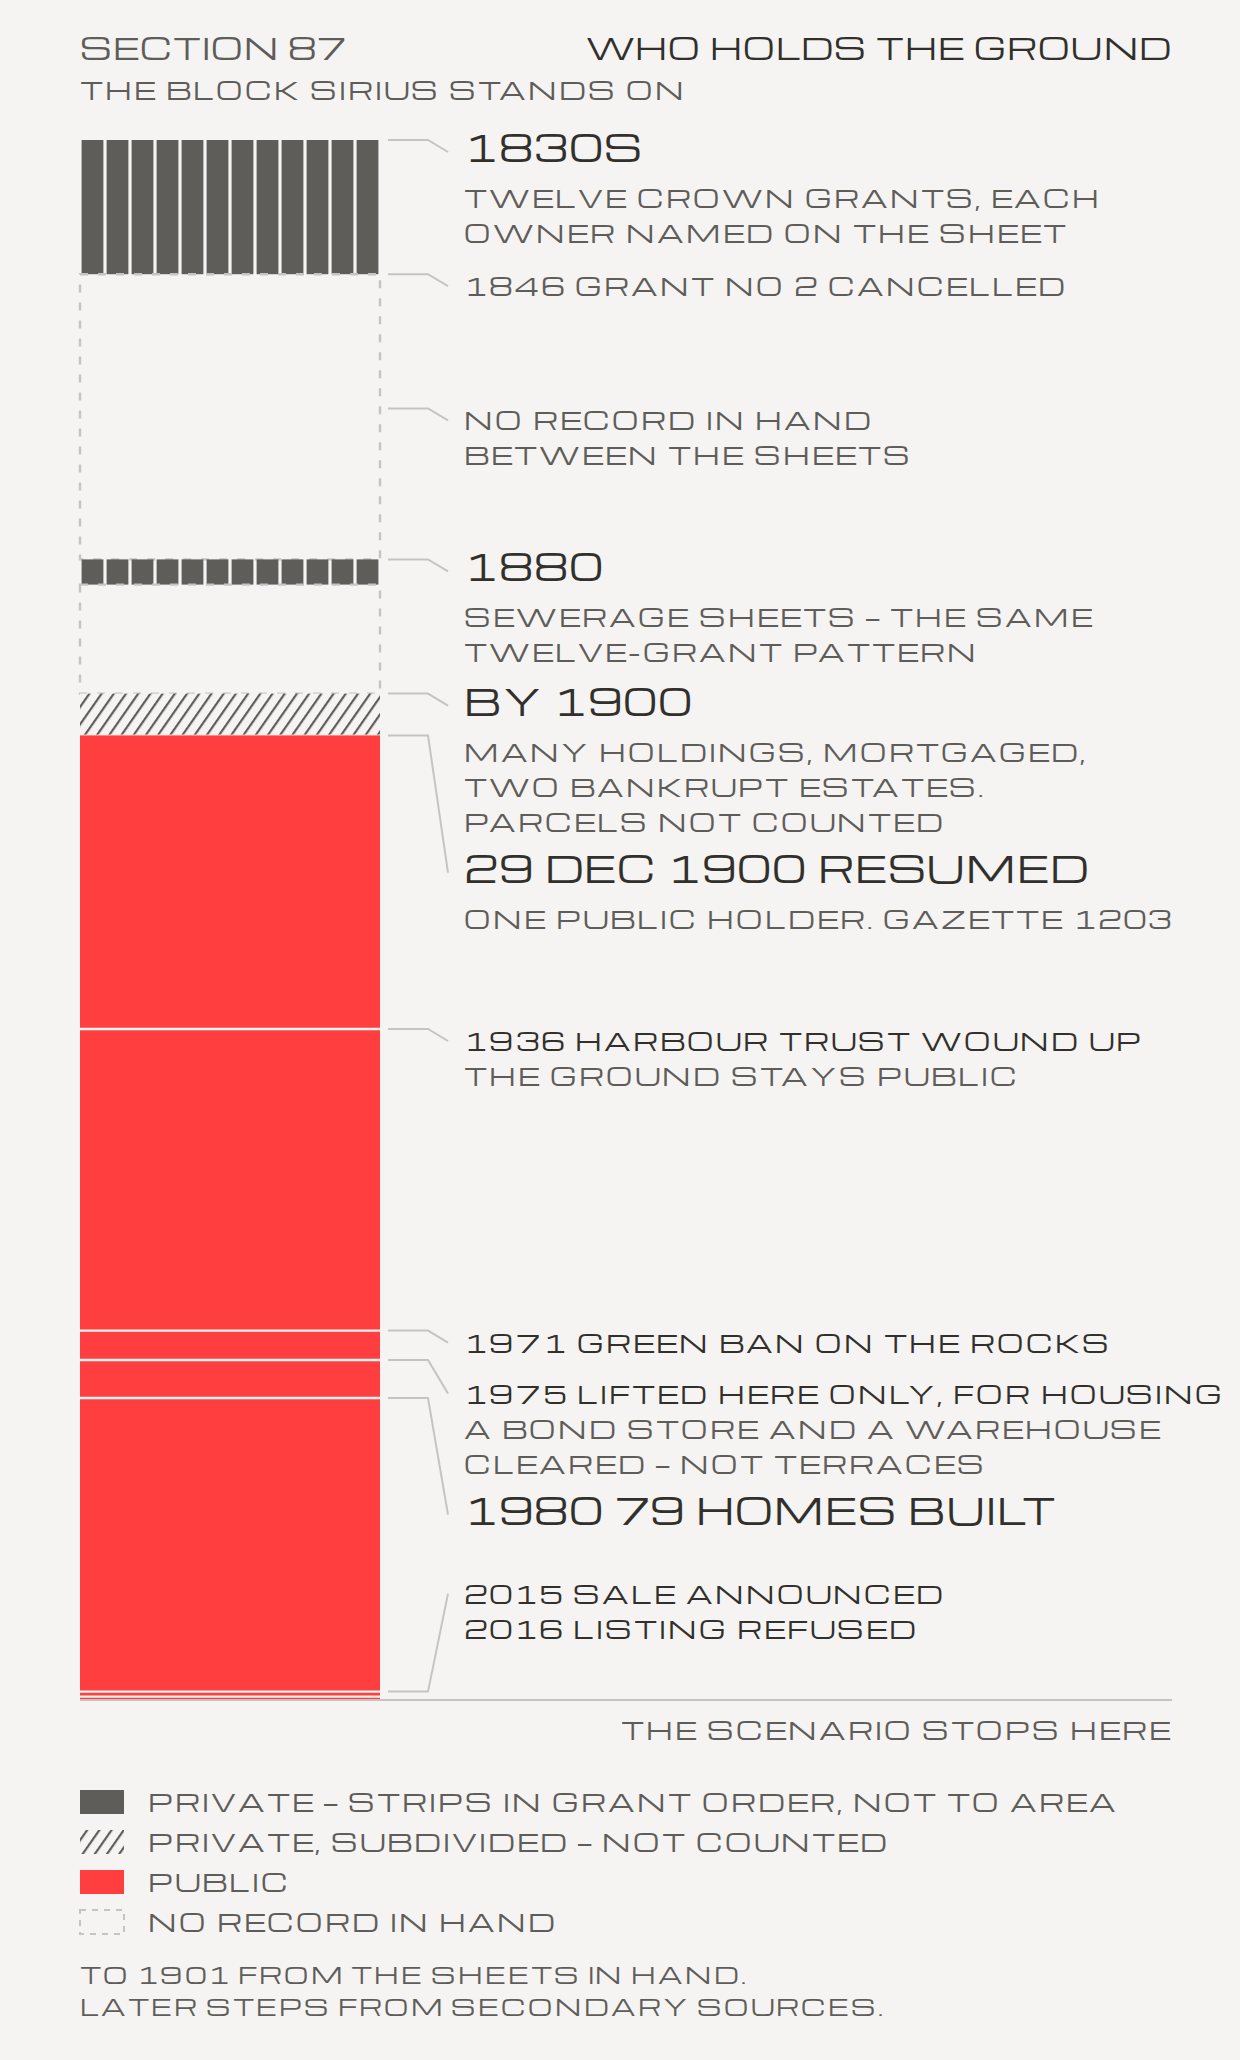
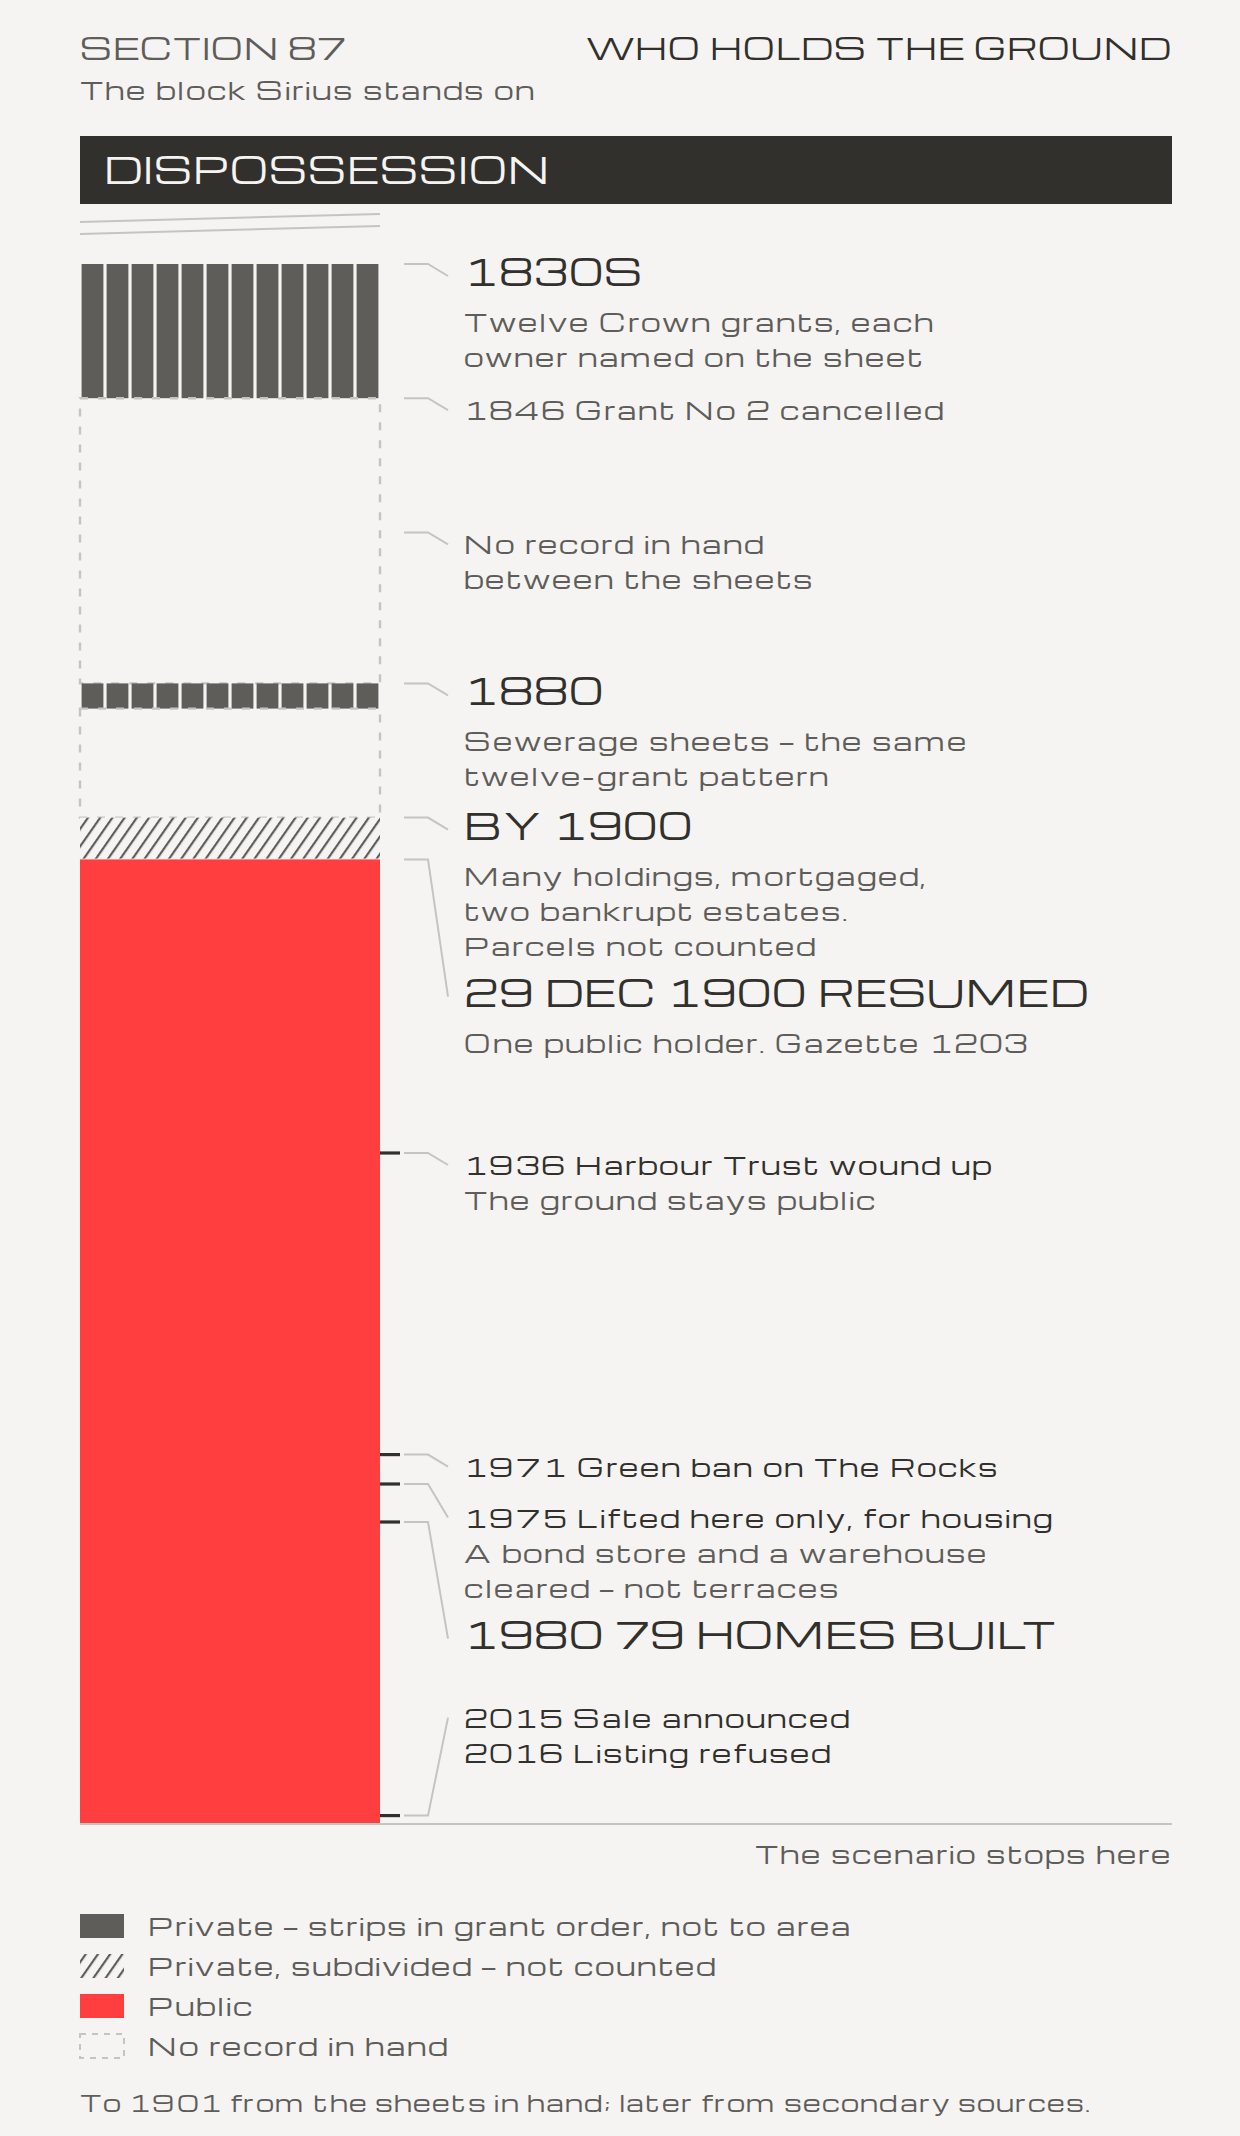
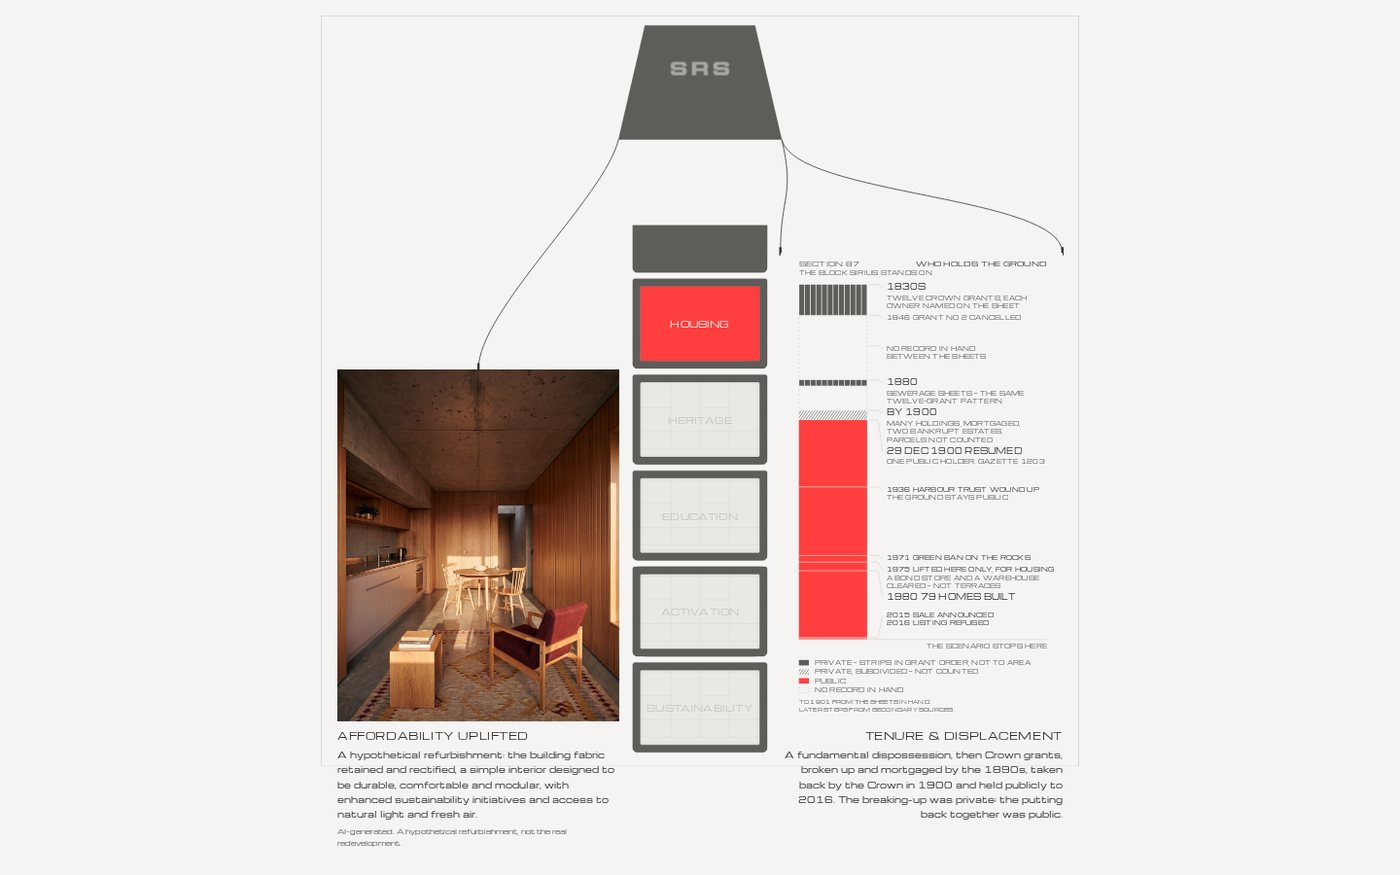
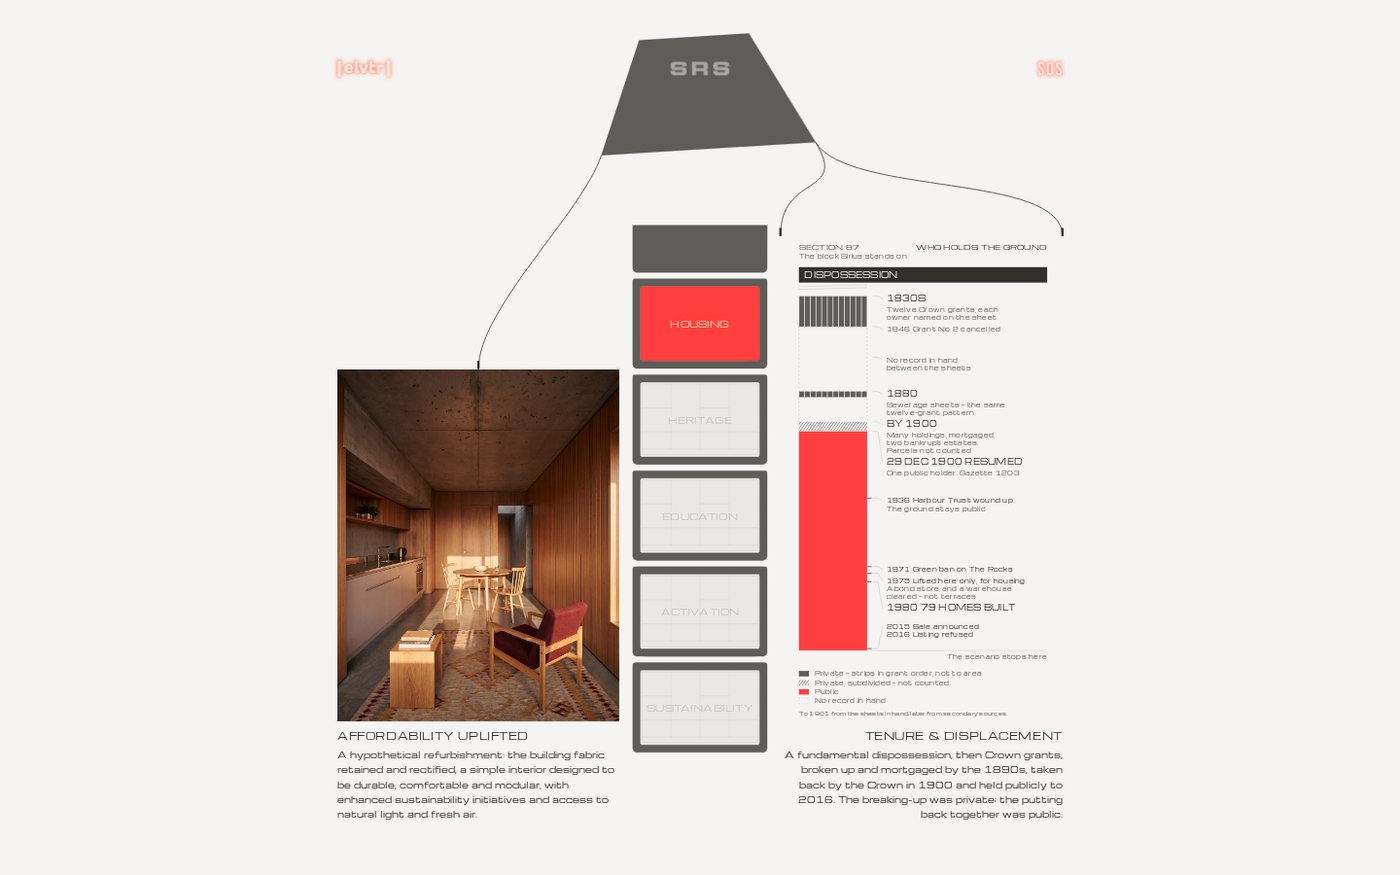
The plan was a chart of how many people lived on the site over time. The historic documents turned out to name owners, not residents, so it became a drawing of who held the ground. Private hands broke it up, and public hands put it back together.

Draw what your sources contain, not what you hoped they'd contain.

Read the full accountClose the full account
The first version on the page.
After the review: the events as ticks at the block's edge, and the dispossession band across the full width.

Read your sources before you fix the drawing. Housing was meant to be argued through occupancy over time, across four eras. Only the Sirius era had both a resident count and an area. Before 1788 there's no figure at all, and the terraces were partial. The six historic sheets in hand turned out to be ownership documents. They name owners, trustees, mortgagees, assignees and bankrupt estates, and across all six there isn't one resident count.

So change the drawing, not the evidence. Tenure is what the sheets support, and it argues the principle more directly: affordability as purpose rather than concession is a claim about who holds the title. The drawing runs down the page through time. Twelve Crown grants appear as twelve strips, in grant order rather than to area. Years between the sheets in hand are dashed gaps. The subdivision by 1900 is drawn as texture, because the parcels were never counted. Then there's one public holder from 29 December 1900 to the 2016 cutoff. Above it all, undated and full width, is a band marking dispossession: a condition over the whole sequence, not one stage in it.

Watch for errors you've inherited. A working note had said since early on that terraces were cleared for Sirius. The terraces went in 1900–01, under the plague resumption. What stood on the site in the 1970s was a bond store and a Housing Board warehouse. That's seventy years and two different causes apart. It rested on a single source when it was found, so it was kept off every drawing until it was confirmed. It now is, and the drawing says so as fact. A drawing counting homes wouldn't have survived that correction. The tenure drawing did.

Respect your own cutoff. The chain carries on past 2016 with a sale and a redevelopment, and it would make a strong ending. But the scenario is set before 2017, so nothing after 2016 goes on any drawing.

When the documents won't support the chart you planned, change the chart. And keep a single-source fact off the page until a second source holds it.

07

The paperwork drawing

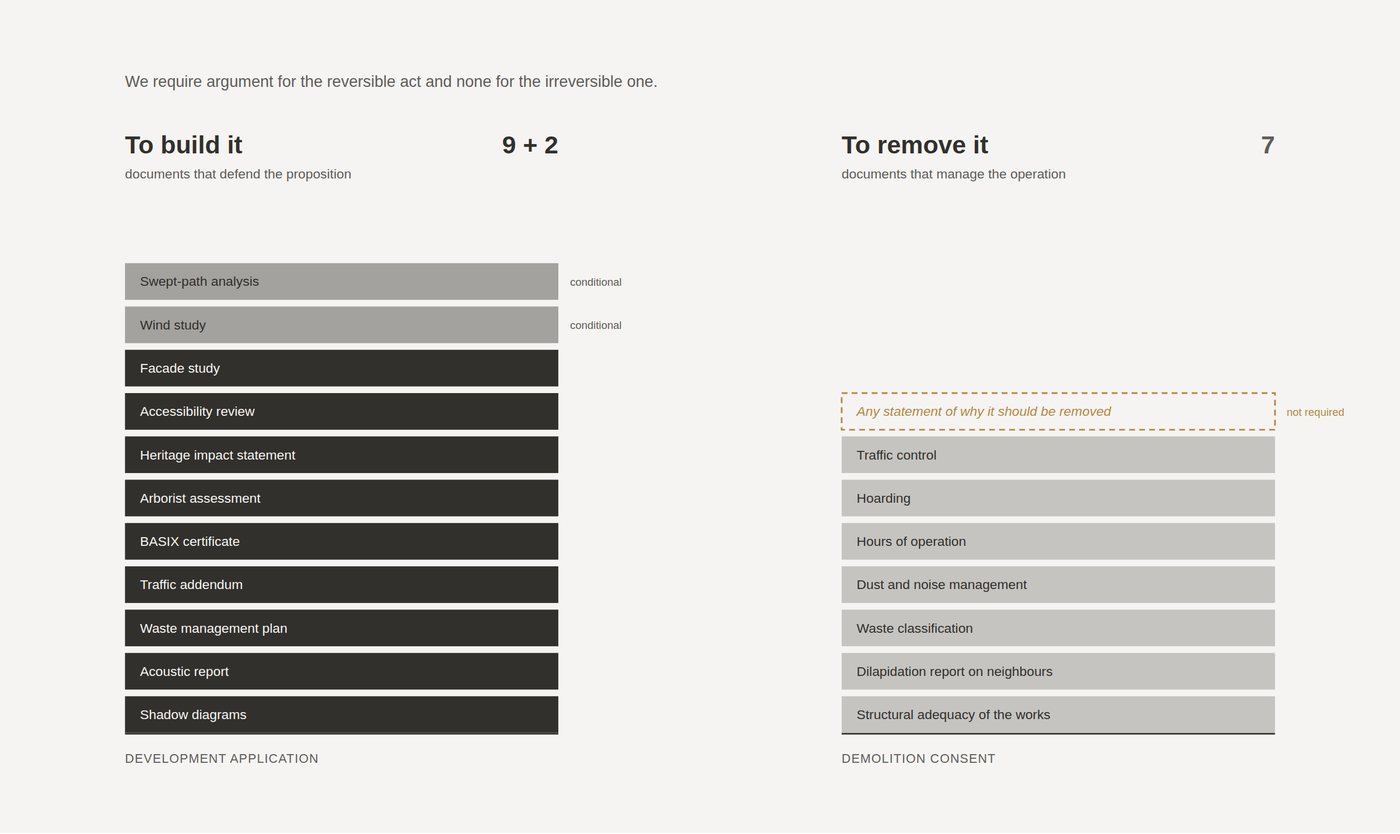
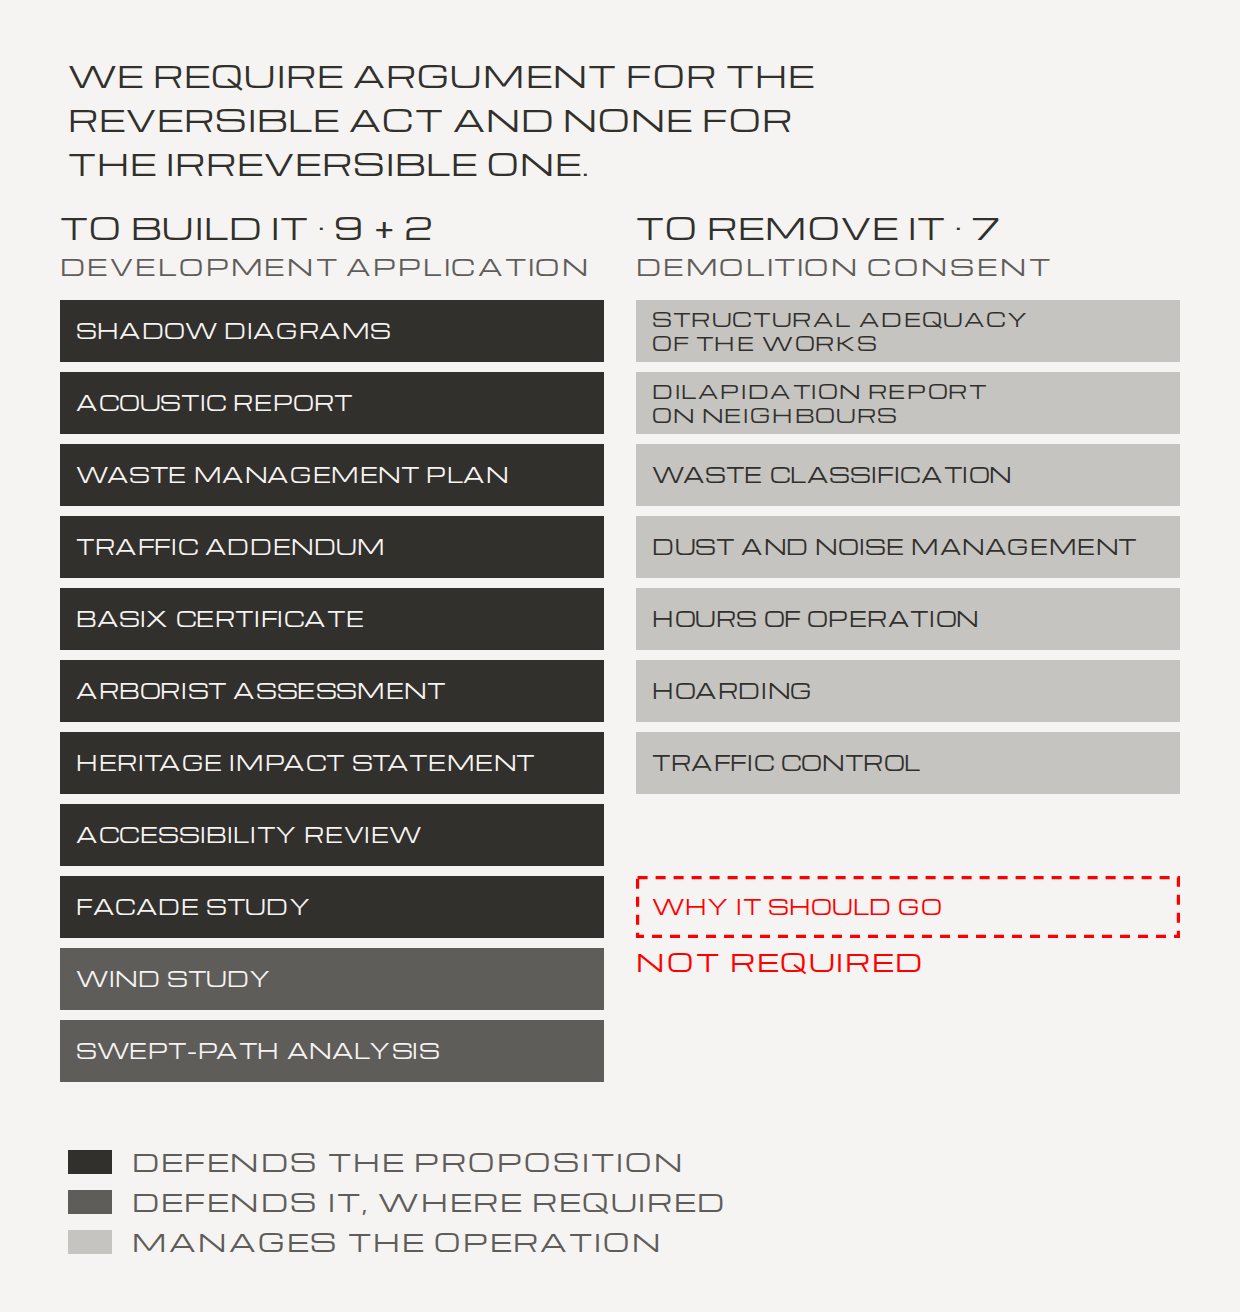
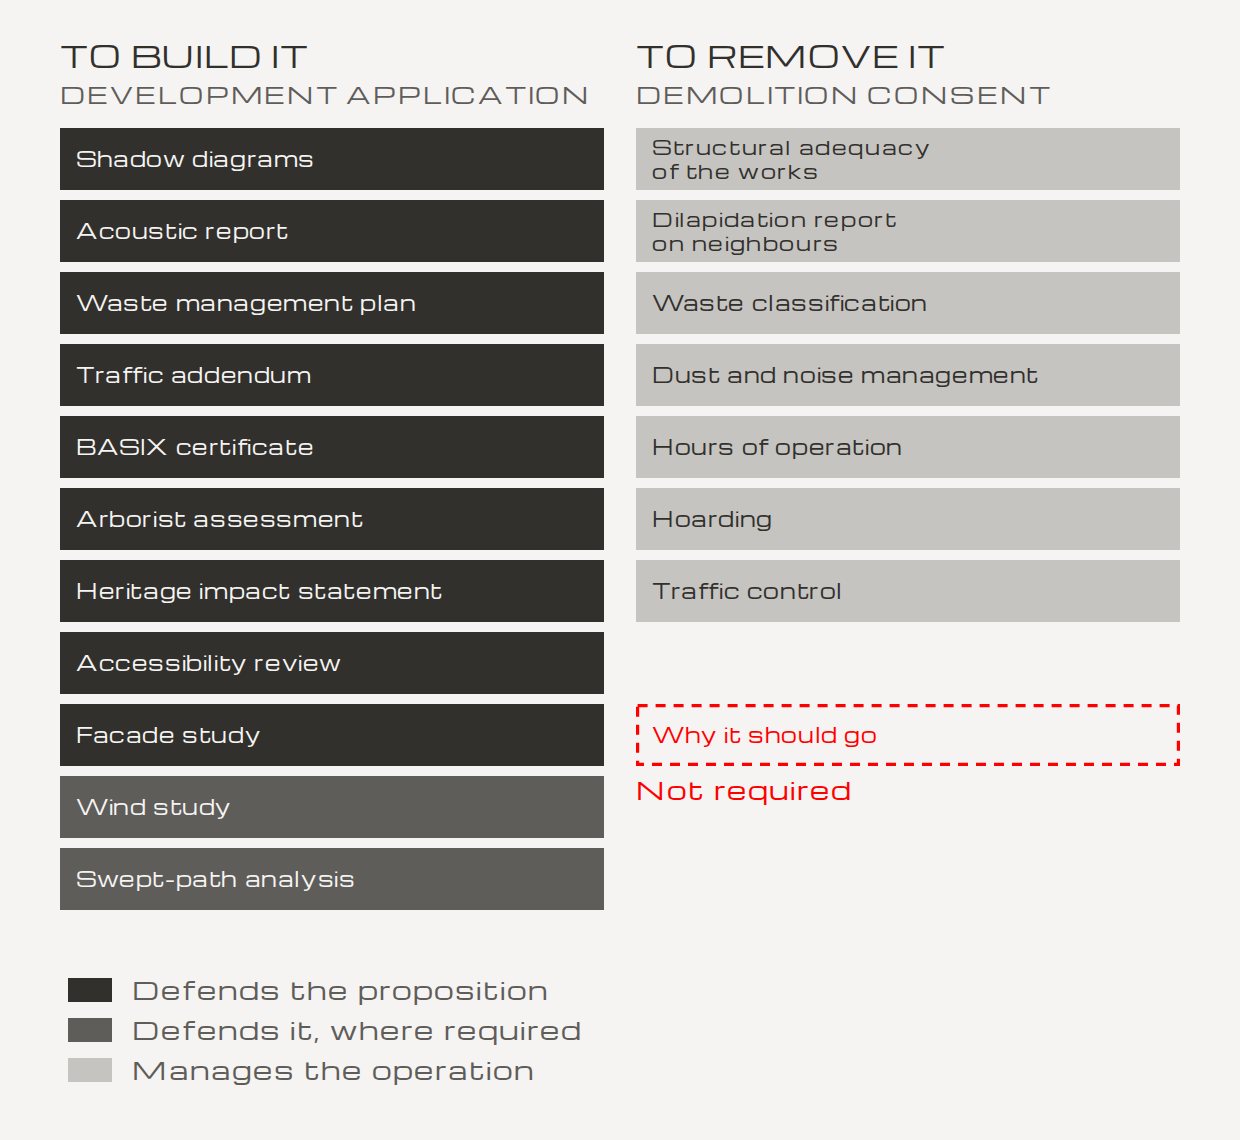
The heritage argument already had a diagram, written into the essay it came from. On one side is the stack of documents a development application has to provide. On the other is what a demolition consent needs, which has no document arguing why the building should go. Nothing was generated.

Look for the drawing that already exists.

Read the full accountClose the full account
The first version, drawn as a sheet.
Redrawn for its box, still with its heading sentence and counts.
Now: heading and counts off, rows in sentence case, the empty red slot arriving last.

Before you make a drawing, check whether your argument already is one. The plan here was to re-tone a drawing of the precast panels. It was replaced, because the essay behind the heritage principle, Against Demolition, opens with the diagram it needed. It's the list of documents a development application must provide, set against the list a demolition consent requires. There's no justification document on the demolition side. That states the thesis in one image, and it needs no generation.

Be careful what you rest the claim on. The obvious evidence was statutory: no heritage item is mapped on the lot. It was demoted to an exhibit rather than used as the ground of the argument. Resting the claim on the map would make the map the arbiter, which is exactly the move the essay refuses. The empty map is evidence of the mechanism, not the reason.

Then draw it so the gap is the thing you see. The document names were kept exactly. Two long demolition names wrap onto two lines rather than shrinking below legibility. The missing document is an empty red slot: why it should go — not required. A reviewer judged this the strongest of the five drawings and still cut it back. The heading sentence and the counts came off, the rows went into sentence case, and the drawing now builds row by row, with the empty red slot arriving last.

If the argument is already a picture, draw that picture. And don't let the evidence become the authority your argument is written against.

08

The art schools drawing

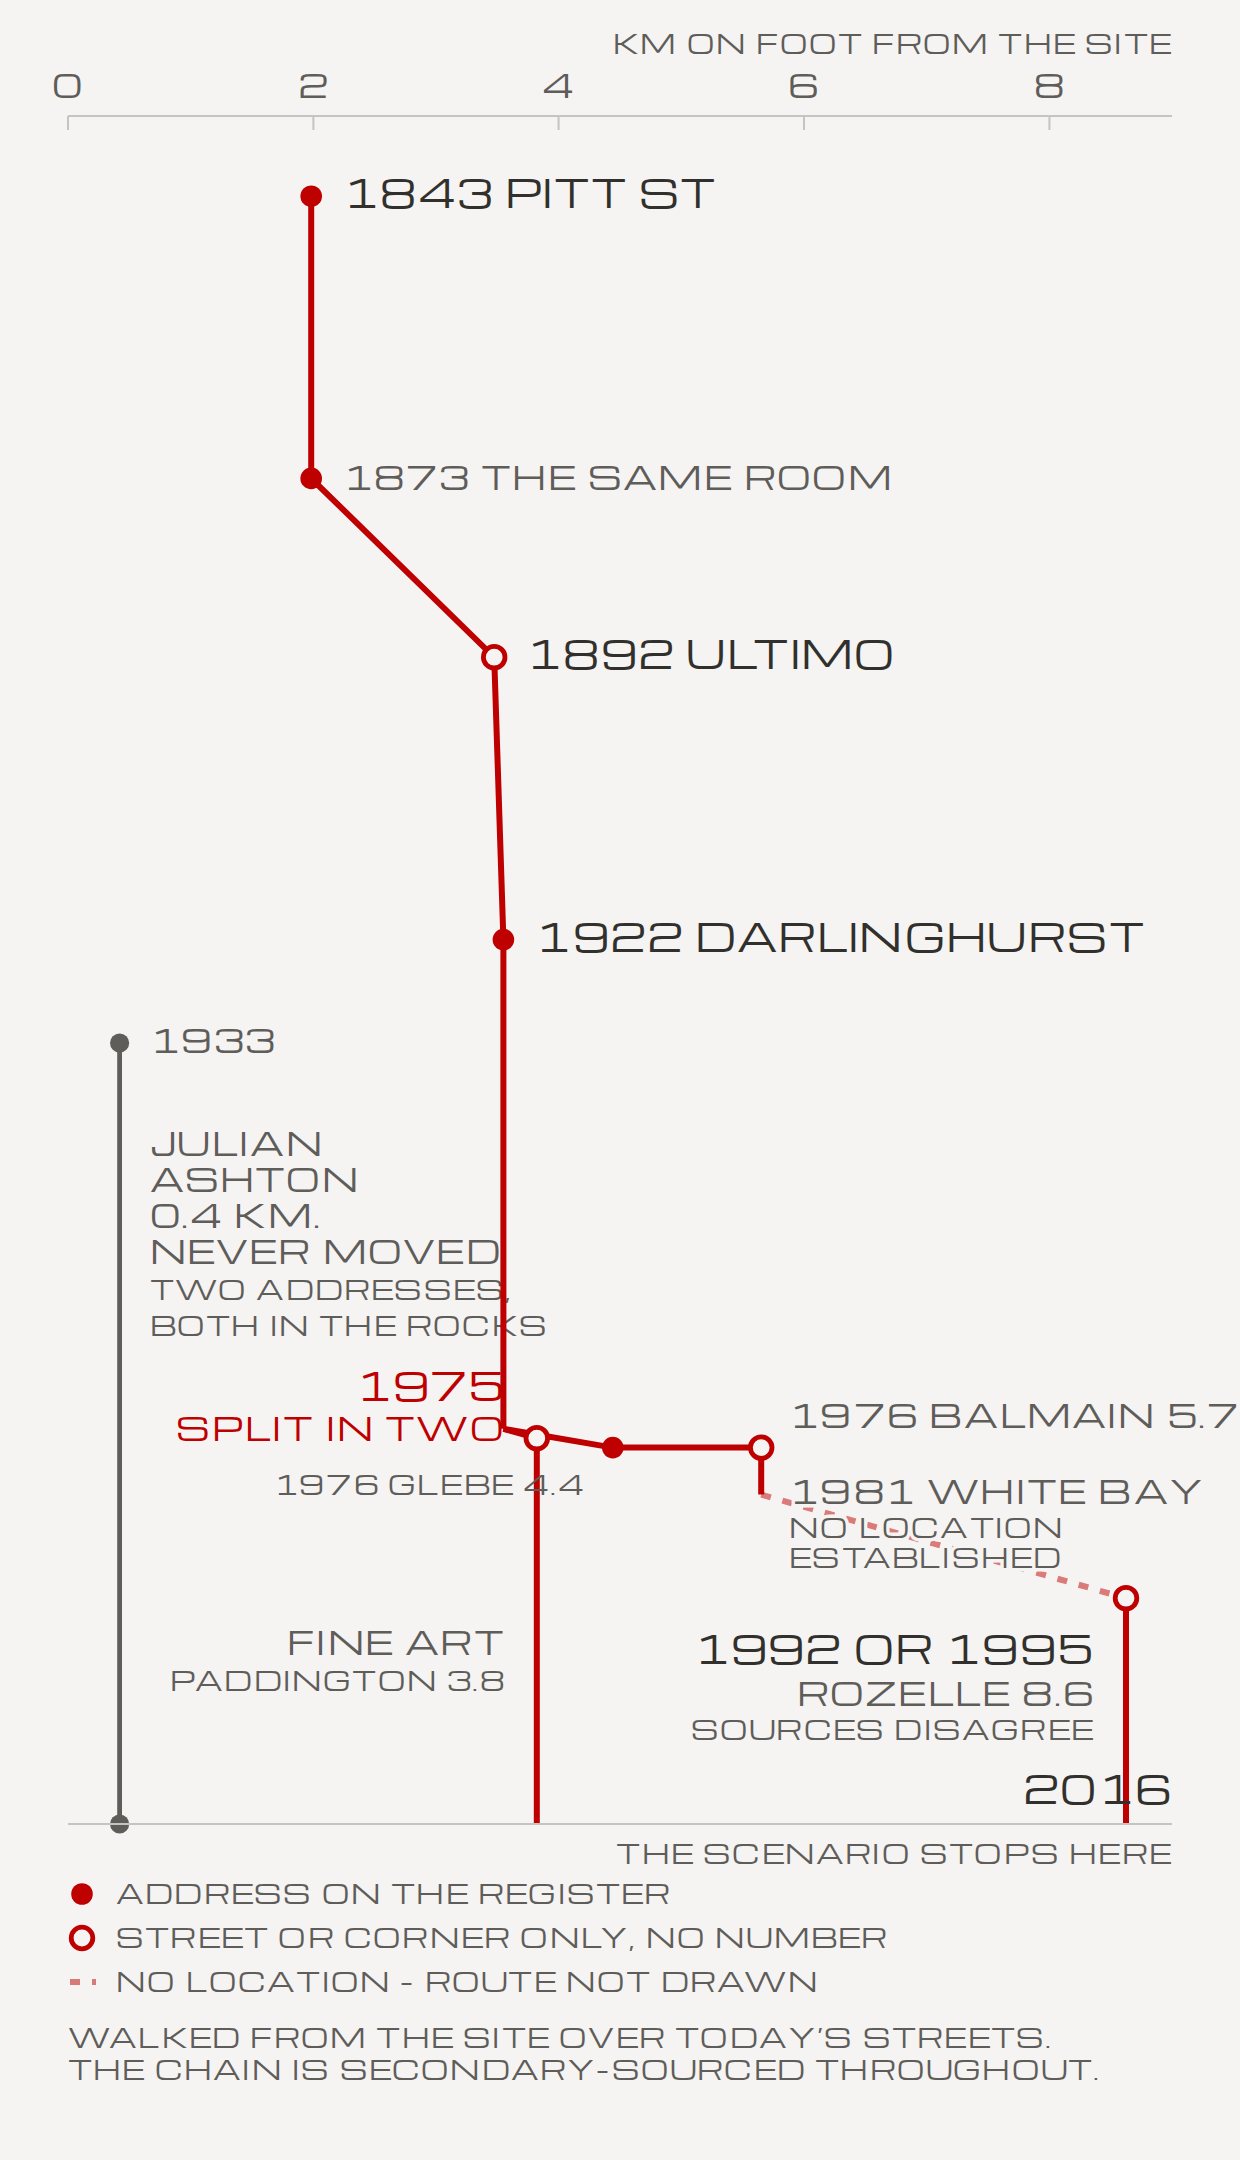
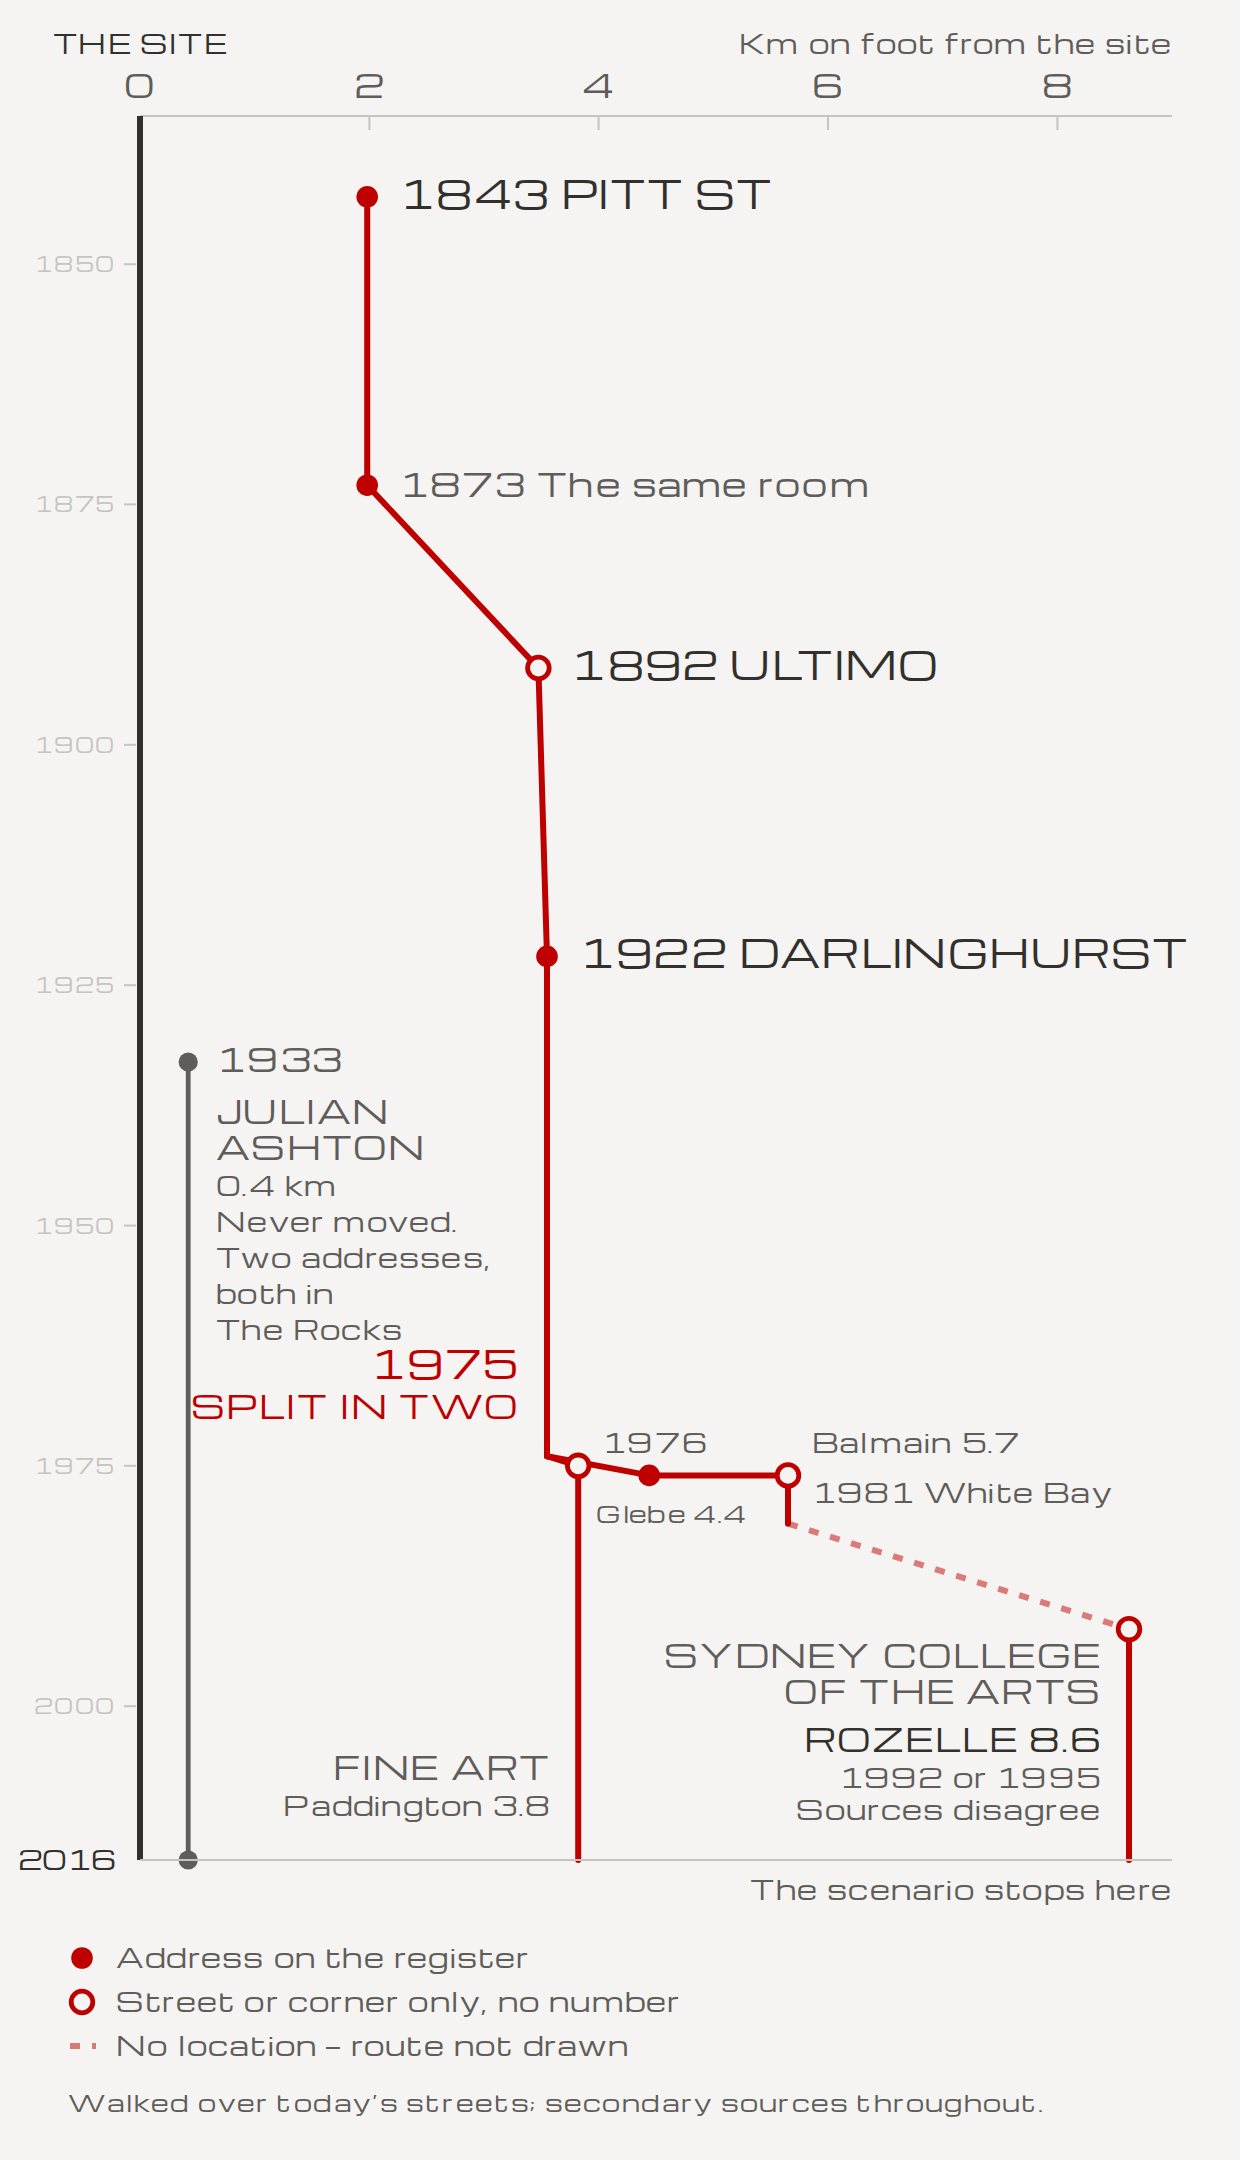
The claim was that art schools had been pushed out of the precinct. The sources showed something sharper: one public art school, moved repeatedly by government and then absorbed by two universities. They also turned up a private school that has stayed two streets away since 1933. That school is drawn as the constant, and the drawing marks where its own evidence is weak.

Put the fact that complicates your claim on the drawing.

Read the full accountClose the full account
The first version on the page.
After the review: a line for the site at zero, each branch named at its end, every label off the lines.

Source the premise before you draw it, and let it change shape. What looked like several schools drifting away turned out to be one public school: Pitt Street in 1843, Ultimo in 1892, the Darlinghurst Gaol in 1922, a move fought off in 1974, then split in half, ending at Paddington and Rozelle, 1.8 to 3.1 km away. One subject moving through time is a better drawing than a scatter of institutions. It's also the same shape as the tenure drawing.

The sourcing turned up two more things. First, the timing. The merger that would have ended that school was announced on 21 June 2016. Students occupied the executive offices from 22 August to 25 October, and the rally to save Sirius was on 17 September. That's two campaigns, two months apart and a kilometre apart, both inside the scenario. Second, the awkward fact. Julian Ashton Art School is 260 m from the site and has been in The Rocks since 1933. A drawing of art schools displaced that left it out would be false. So it's drawn as one flat line against a line that marches away, and it answers the objection that displacement argues loss rather than belonging. Art teaching in The Rocks never left. The public version did. The caption says private, not expensive, because nothing sourced says what any of these schools cost.

Choose your measure, and say which one it is. Distances are walked over today's streets, because walking is what displacement means to a person, and the drawing says so. That choice caught a claim made in the session: that the school's earlier address was closer to the site. True as the crow flies, false on foot by 27 m. It was withdrawn.

Then show the drawing's own confidence. There's no primary source in this chain, only the Dictionary of Sydney and Wikipedia, and the drawing says that on its face. Registered addresses are filled markers. Streets without numbers are hollow. A move with no known location is a faded gap with no route drawn. Where two sources give different years, both years appear. A line at 2016 reads "the scenario stops here".

Last, draw it at the size it's seen, and look at it rather than reasoning about it. A label running off the edge and six labels piled on top of each other only showed up once it was rendered. A reviewer still called it the weakest finish of the five. The site got its own line at zero, each branch was named at its end, and every label was moved off the lines. It now walks stop by stop from 1843.

Draw your evidence at the strength it has: filled where it's firm, hollow where it's thin, a gap where there's nothing.

09

The ground plane

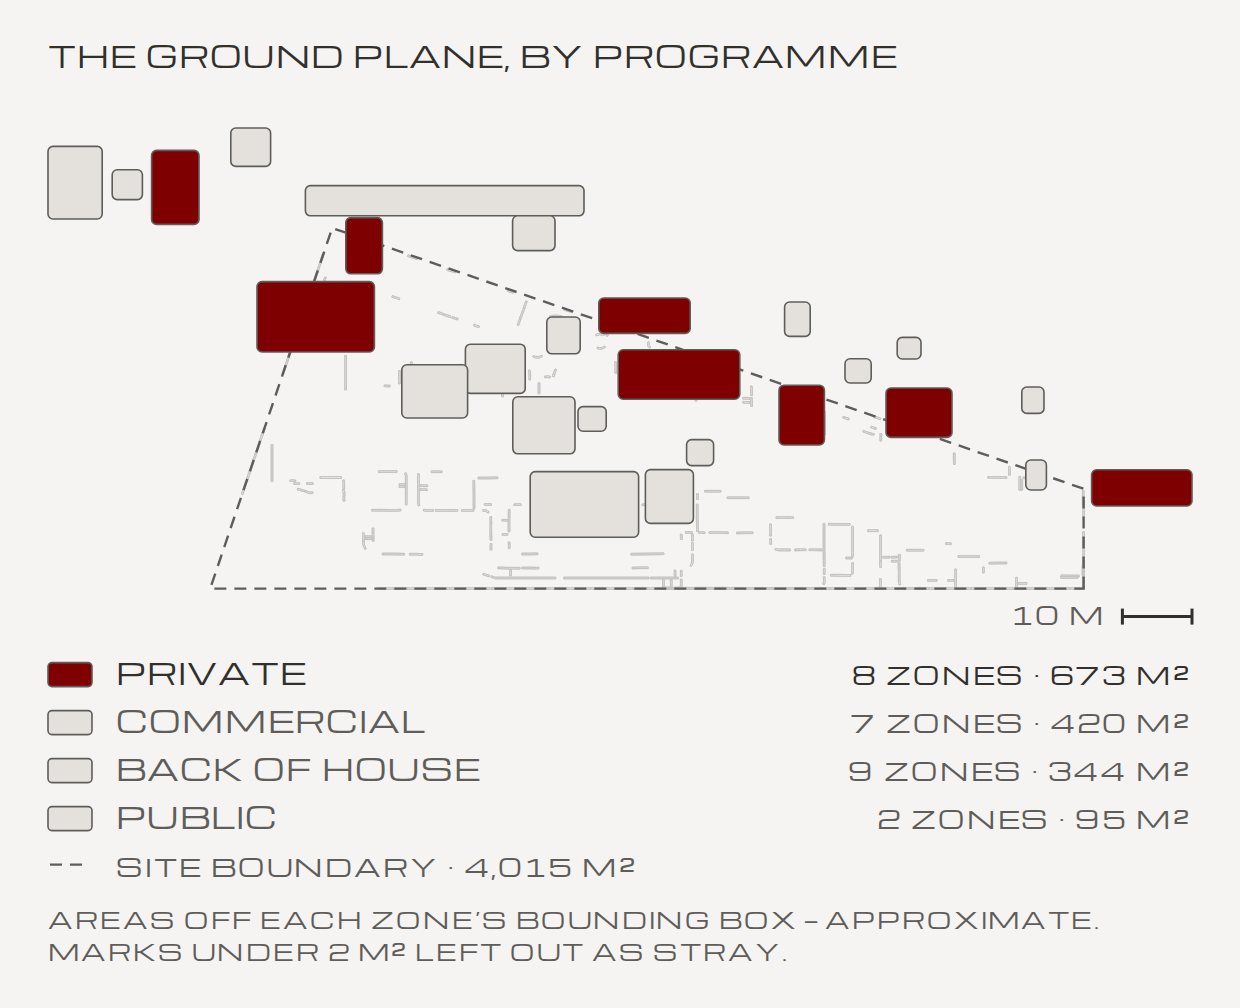
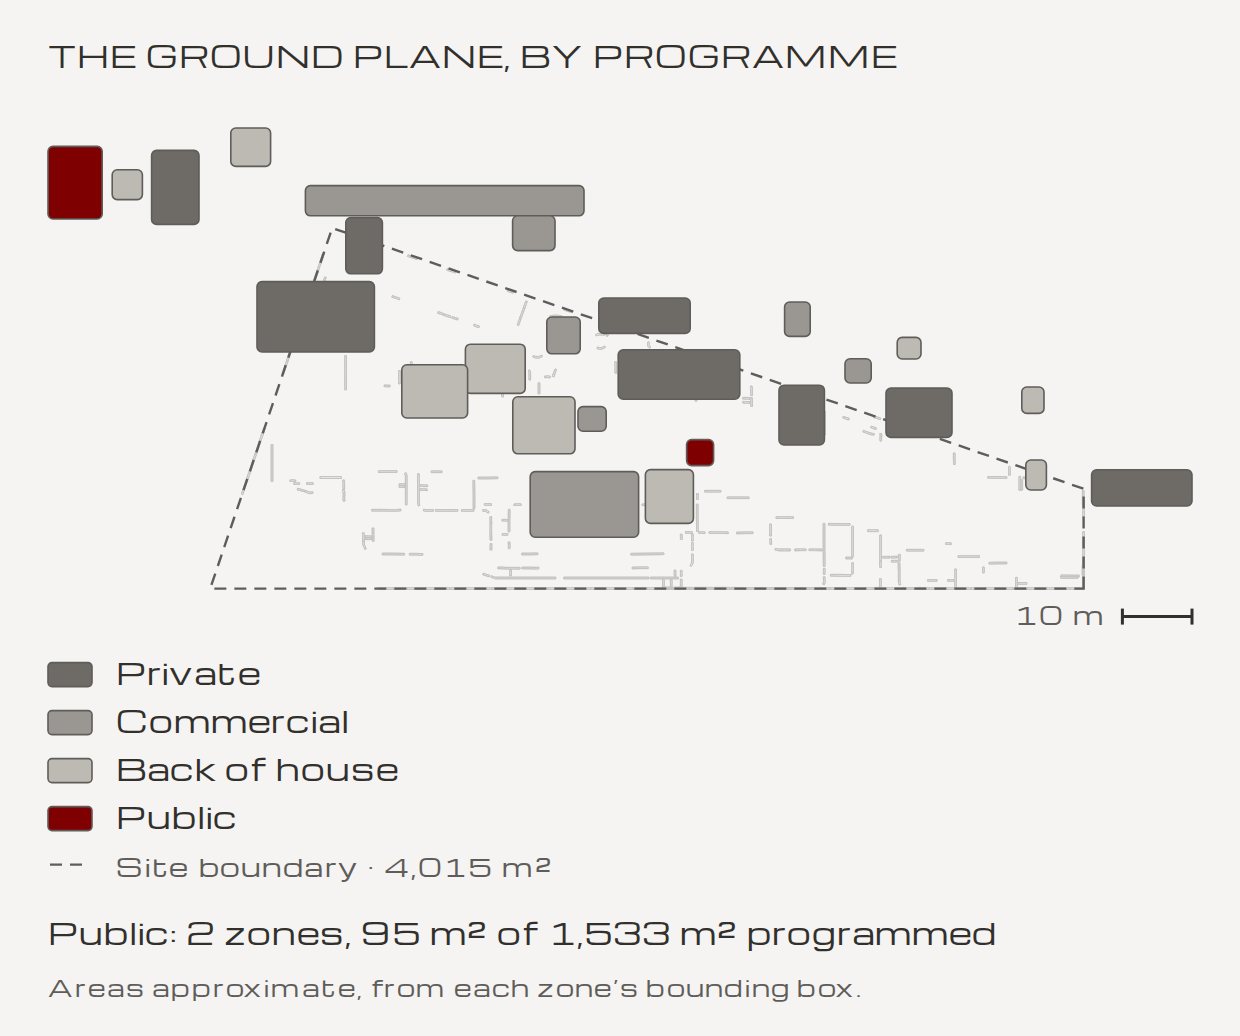
Read from a marked-up plan of the proposed ground floor, this drawing shows public space as two small zones, 95 m² of 1,533 m² programmed. That's deliberate. Its first version lit one use at a time and argued nothing, until a review against its caption had it rebuilt to build up in layers.

Test a drawing against its caption, not against a checklist.

Read the full accountClose the full account
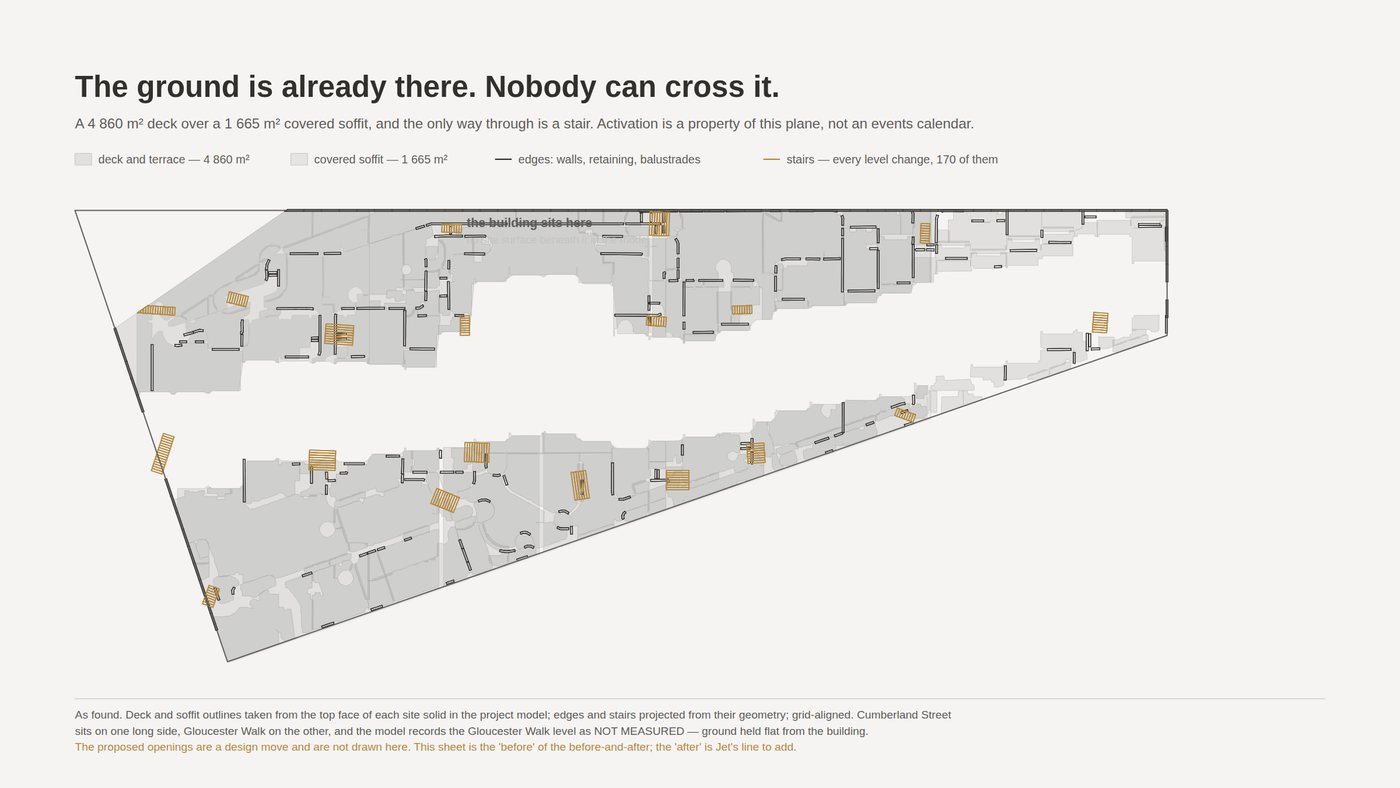
The earlier drawing: the existing ground floor, drawn from the model. The "after" was never drawn.
The first version on the page, which lit one use at a time.
Now: the uses build up, and public arrives last and holds.

Don't draw the designer's line for them. An earlier activation drawing was meant to show the ground floor before and after. "Before" was drawn from the model. "After" wasn't, because the new openings are a design move, not a measurement. Drawing them would have meant inventing the line, and the sheet said so. What replaced it was read straight from a marked-up plan: twenty-seven zones in four uses (private, commercial, back of house and public).

When a number looks like a mistake, ask before you fix it. Public came out at two zones, about 5 per cent of the marked ground. That was challenged as a possible omission and confirmed as the point. A big new plaza would contradict the principle, which says the programme does the activating, not an events calendar. Small on purpose only holds if the caption says so. Otherwise it reads as a thin proposal rather than a deliberate one. So the caption does: two small public zones, deliberately, inside a ground plane that residents, students and trade already fill.

Count carefully, and say how you counted. The first count split some outlines into pieces and counted each piece as a zone. Grouped properly, commercial went from ten zones to seven and back of house from seven to nine. Eleven marks under 2 m² were left out as stray. Areas come from each zone's bounding box, so they read slightly high, and the drawing says that on its face. The plan is turned a quarter so its long side runs across the box. There's no north arrow, because the file carries no north, so a 10 m scale bar stands in.

Then judge it by its job. The first version lit each use one after another, so the ground was never seen full and public was never seen against the rest, which is the only comparison its caption makes. A reviewer called it the one drawing that failed. It now builds up: private, commercial and back of house light in quiet tones and stay lit, then public arrives last in the strong colour and holds. The table of areas became one line, public against the total. For anyone who has reduced motion turned on, it shows the finished state and doesn't animate.

Before you finish a drawing, read its caption and ask whether the drawing makes that comparison visible. If it doesn't, redraw it.

10

The home statement and the name

The first screen carries 68 words and a name, SRS, the Sydney Revival School. It touches all five principles without naming any of them, and one verb was moved on purpose so the statement wouldn't contradict a principle. A writing tool refused to write it from nothing, and that refusal was right.

A brief argues. A manifesto lists.

Read the full accountClose the full account
The home screen: the elevation alone. The statement appears when you scroll.

Write the long version first. The written statement for this brief runs to a little over 300 words and names none of the five principles. A reader should find all five without being told they're there. It still stands as the assignment's statement. The home screen needed something else: short, closer to poetry, touching each principle once.

Expect a good writing tool to refuse a blank page. The voice skill used here classified its input as a seed, not copy, and wouldn't generate from nothing. The draft was written plainly instead, so the voice pass had real text to work on rather than an invented one. The short statement started from a seed of its own too, one opening line: an act of architectural repositioning and augmentation that restores, recalibrates, reinstates and reclaims.

Then check every word against the principles. The seed's obvious mapping put restores on heritage. But the heritage principle says outright that it isn't about reinstatement or preservation for their own sake, so restores there would have contradicted the principle on the very first screen. Heritage took reclaims, meaning the social claim, not the fabric. Restores moved to activation, where something really was lost and comes back: a working life in the precinct. In page order, the statement reinstates, reclaims, augments, restores and recalibrates. None of the five window titles appears in it, so it never captions its own buttons. It carries one figure, seventy-nine homes, and that figure is sourced.

Flag a word's baggage before you keep it. No real body carries the name. The risk was architectural: revival is the word for historicist styles, the pastiche the heritage principle refuses. It was kept, because it also reads for free as a revival of the Sydney School, the lineage the same principle claims. Know which absolutes you're signing, too. "Nothing is demolished to make it" is true of everything on record, but it's an absolute, and whoever stands behind the statement stands behind that.

Say what kind of thing it is. The statement doesn't say the proposal is speculative, so a line beneath it does: a speculative proposal, set before 2017. Nothing after that year is assumed. And accept an honest cost. The 68 words push the first screen just past the fold on a laptop. Widening the measure halved the overhang but didn't clear it, and it wasn't chosen on the pretence that it would.

Map every word to the principle it carries, and check it doesn't argue against another one.

11

The page itself

One drawing of the elevation carries the whole site. The five windows are the buttons, and a cap morphs between six states. Almost every fault on the way was invisible until it was measured or looked at, and the most useful one showed up looking like the wrong problem entirely.

The fault you can see isn't always the fault you have.

Read the full accountClose the full account
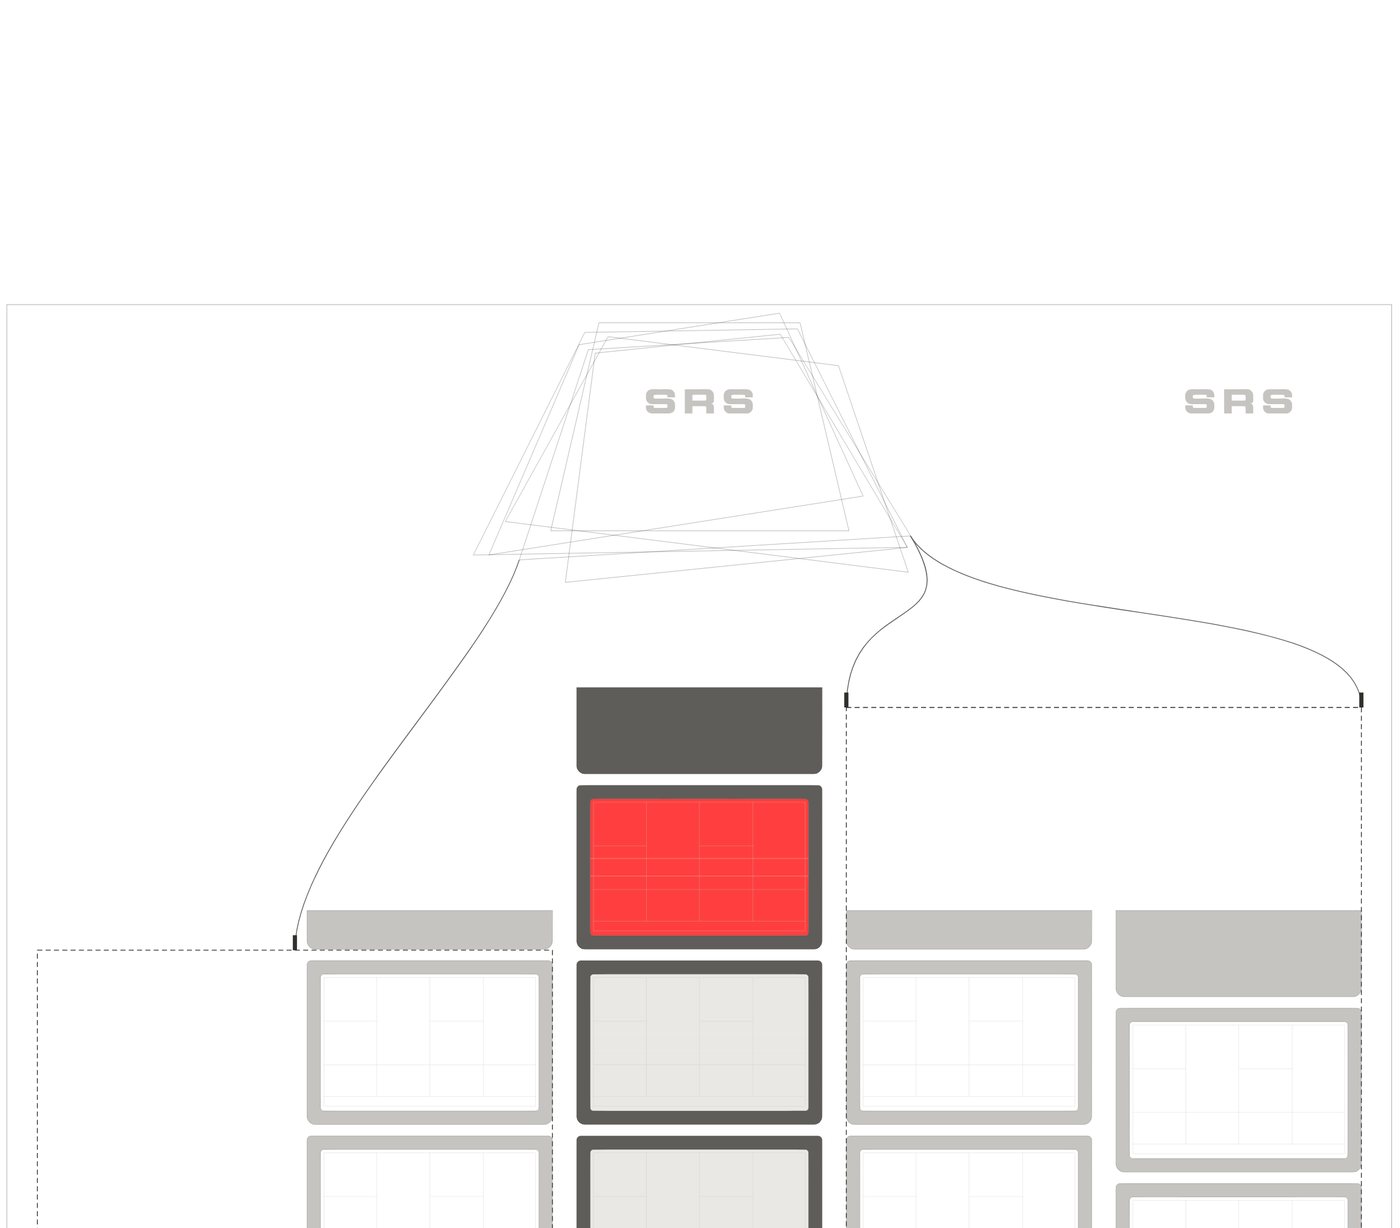
An export for drawing the caps: the housing state with its generated leaders and plate outlines, in the drawing's own coordinates.
The housing state in the first live draft, with the sheet frame still drawn.
The same state now.
The same state now.
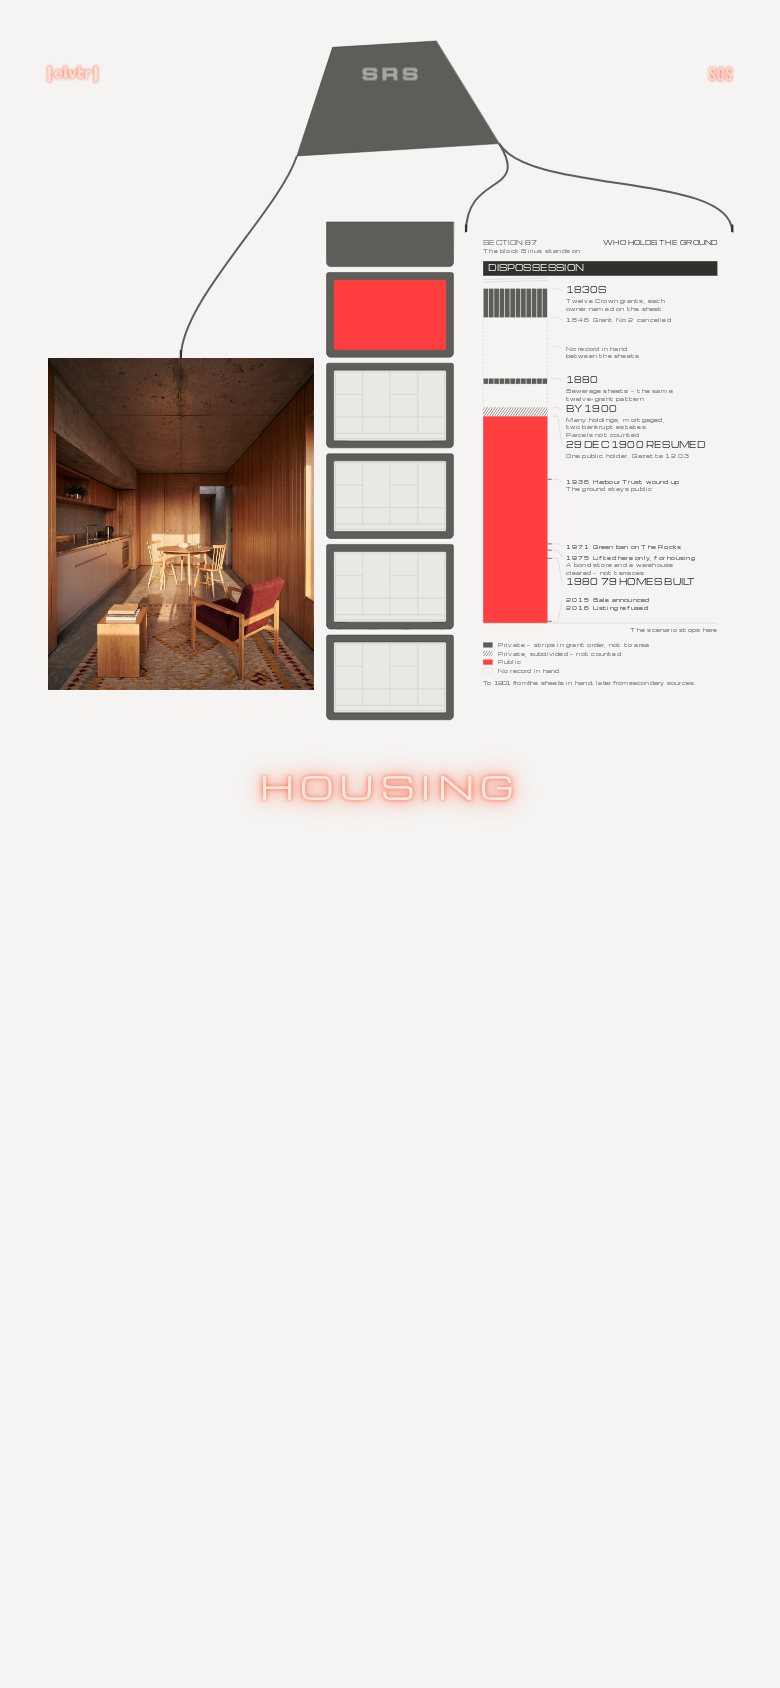
The same state on a phone: the plates stay on the drawing, and the window's name glows beneath it.

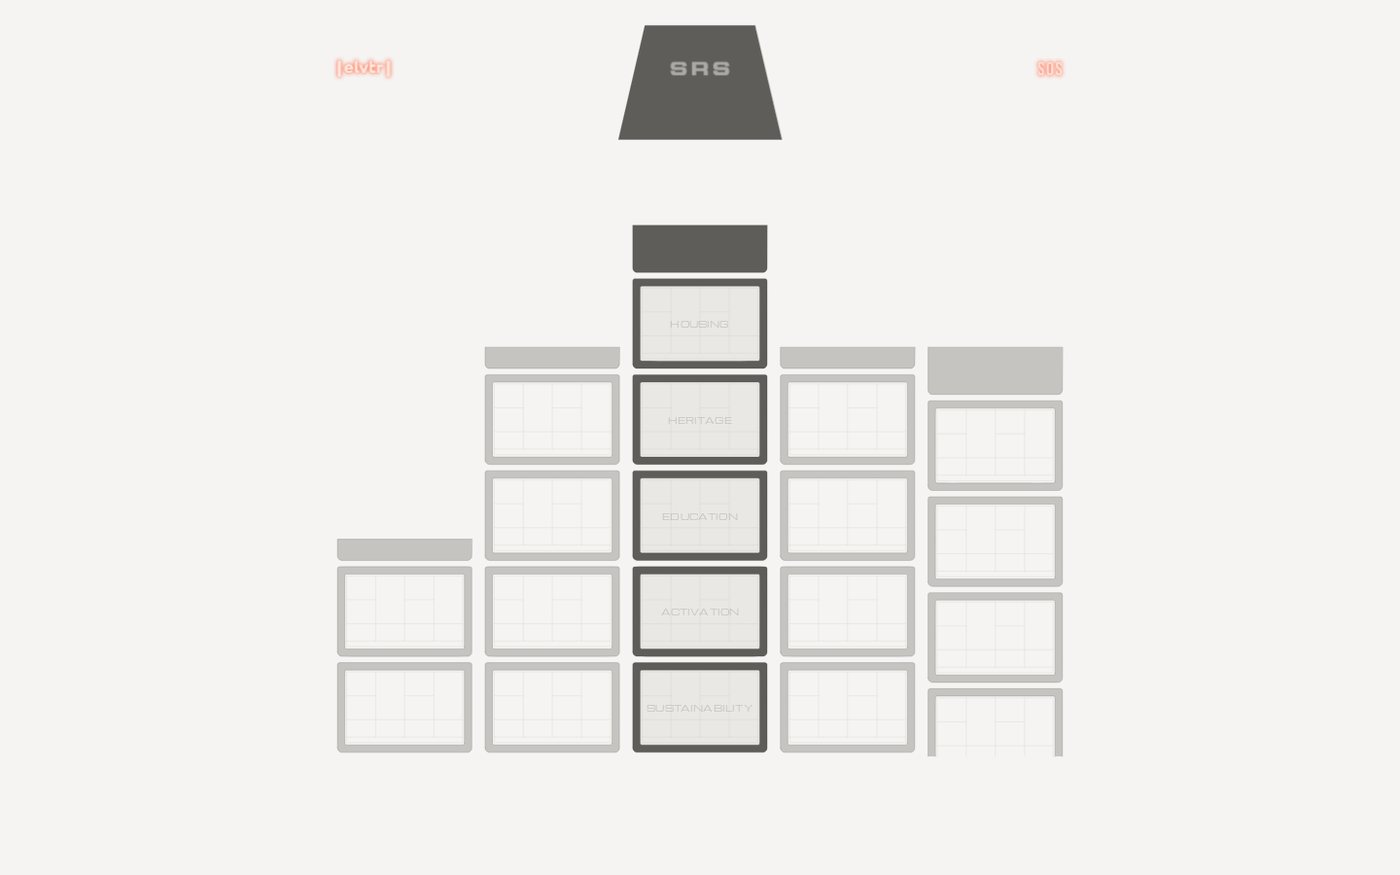
Build from one drawing, not six. Six files make every change of state a cut, and the cap morphing, the columns fading and the leaders growing all need the same shapes to stay put. Put the buttons on the building. The five windows are the five states and the cap is the way home, so order comes from position on the elevation, and a numbered menu would only say the same thing worse. The address still updates silently, so back, sharing, find-in-page and printing all still work. Keep the text out of the drawing. Text inside a scaled drawing lands at about 3 pixels on a phone. Text laid over it reflows, can be searched, and reaches screen readers.

Generate what follows a rule. The leaders were never drawn. They follow from the cap corners and the box tops, so only the caps had to be drawn. For the caps to morph rather than cross-fade, all six had to have four corners in the same order. That rule was written down before they were drawn, and it's what made the morph work without hand-fixing.

Make every drawing for the frame it's seen in. The five drawings were first placed as sheets 1,680 units wide, and their type came out at 2.6 pixels on a laptop and 1.1 on a phone. All five were redrawn at the width of their box.

Check the face you're actually using. For five sessions every screenshot showed a fallback typeface, not the real one. The real face turned out to be right for the building, and it also showed that SUSTAINABILITY didn't fit its window, that its percent sign reads badly, and that it has no subscript two. All five titles shrank together, so no one title reads as more important. The font is now embedded, so a failed download can't silently swap every word on the page.

Test on the device you're least likely to test on. Titles that light up only under a mouse leave a phone user looking at five blank panels, so every title sits at a quarter strength on every device. On a phone the image and drawing stay small on the elevation, where the leaders land, and grow to full width as you scroll.

Measure before you change a number. The leaders once stalled three quarters of the way along. It looked like a timing problem, but it was geometry: one fixed dash length against lines of very different lengths, so halfway was never halfway. Changing the duration would have made it worse. Twice, a delay after a leader landed turned out to be the curve, not the timing. The line covered its last few units so slowly that it looked finished early. Frame-by-frame measurement found both. A rebuild once hid six faults at the same time, including lines swallowing clicks and a frame drawn in the paper's own colour. None of them showed up until they were looked for.

Say only what you know, even in the details. The window names glow neon after the sign that once hung in the building, but its colour isn't on record, so it wasn't copied. It's a plain red-orange that recalls the sign rather than reproducing it. The link to this page, SOS, comes from the lights that briefly flashed S.O.S. from the building when that sign came down. Each drawing reveals its argument once, in order, and then holds. The credits moved here, word for word.

Keep your drafts. The first live version and the version before the drawings were reworked are kept online beside this one, so you can see what changed between them.

When something looks wrong, measure it before you fix it. The cause is often one level below where it shows.
Credits and sources

The carbon already spent

Monash Urban Lab 2025, public housing towers.

Make Architects 2025, per-m² figures.

12,726 m² gross from the model, 300 mm raster (12,562 m² at 200 mm — the saving does not move).

Benchmarks, not a study of this building.

Image credits

Affordability Uplifted: AI-generated. A hypothetical refurbishment, not the real redevelopment.

The Site, Through Time: AI-generated throughout — every frame regenerated and animated from a source image. Sources include Tribune (CC BY 4.0) and Ben Guthrie / The Guthrie Project (CC BY-SA 4.0); this derivative carries those terms. Frames 1–3 are generated depictions of Aboriginal people and of a rock engraving, and frame 7 derives from a copyrighted film still — both were ruled out earlier in this project and are shown here knowingly. Nothing depicted is a photograph of a real event.

Protected Pedagogy: AI-generated

The Public Realm Repopulated: AI-generated

Retention & Extension: AI-generated